🙋 Student Q&A (Lecture 5)
Click here to learn about timestamps and my process for answering questions. Section agendas can be found here. Email office hour questions to rob.mgmte2000@gmail.com . PS1Q2=“Question 2 of Problem Set 1”

📅 Questions covered Saturday, Mar 1
🕣 3:21pm
❔ What are administered rates?
✔
🕣
❔ Review the graph of Reserves, the Fed Funds Rate. Slide 46 in L5
✔ Covered during section.
📅 Questions covered Tuesday, Mar 4
🕣 7:40pm
❔ Nominal Return, nominal interest rate? Slide 25
✔ Nominal return is the interest rate you earn before accounting for inflation. Real return is the interest rate after accounting for inflation. Real Return is defined as: Real Return = Nominal Return - Inflation Rate
🕣
❔ What is the difference between 4c and 4b? How do we differentiate?
✔
In 4b, you should discuss the downside of overly aggressive expansionary monetary policy. In other words, if the Fed does expansionary monetary policy that is way too aggressive, what bad thing will happen? What are they trying to avoid by moderating their expansionary monetary policy?
🕣 see below
❔ For PS2 Q6b, “if the total money stock (supply) is $100,000, find the total amount of reserves held in the banking system. Show your work. Use a diagram to show what the money supply curve looks like for this economy, fully labeled.”
I am a bit confused about what the diagram is asking me to show. Is it asking me to compare the money supply line from Part A to Part B? Or am I just asked to graph Part B and show where the FFR and discount rate would be?
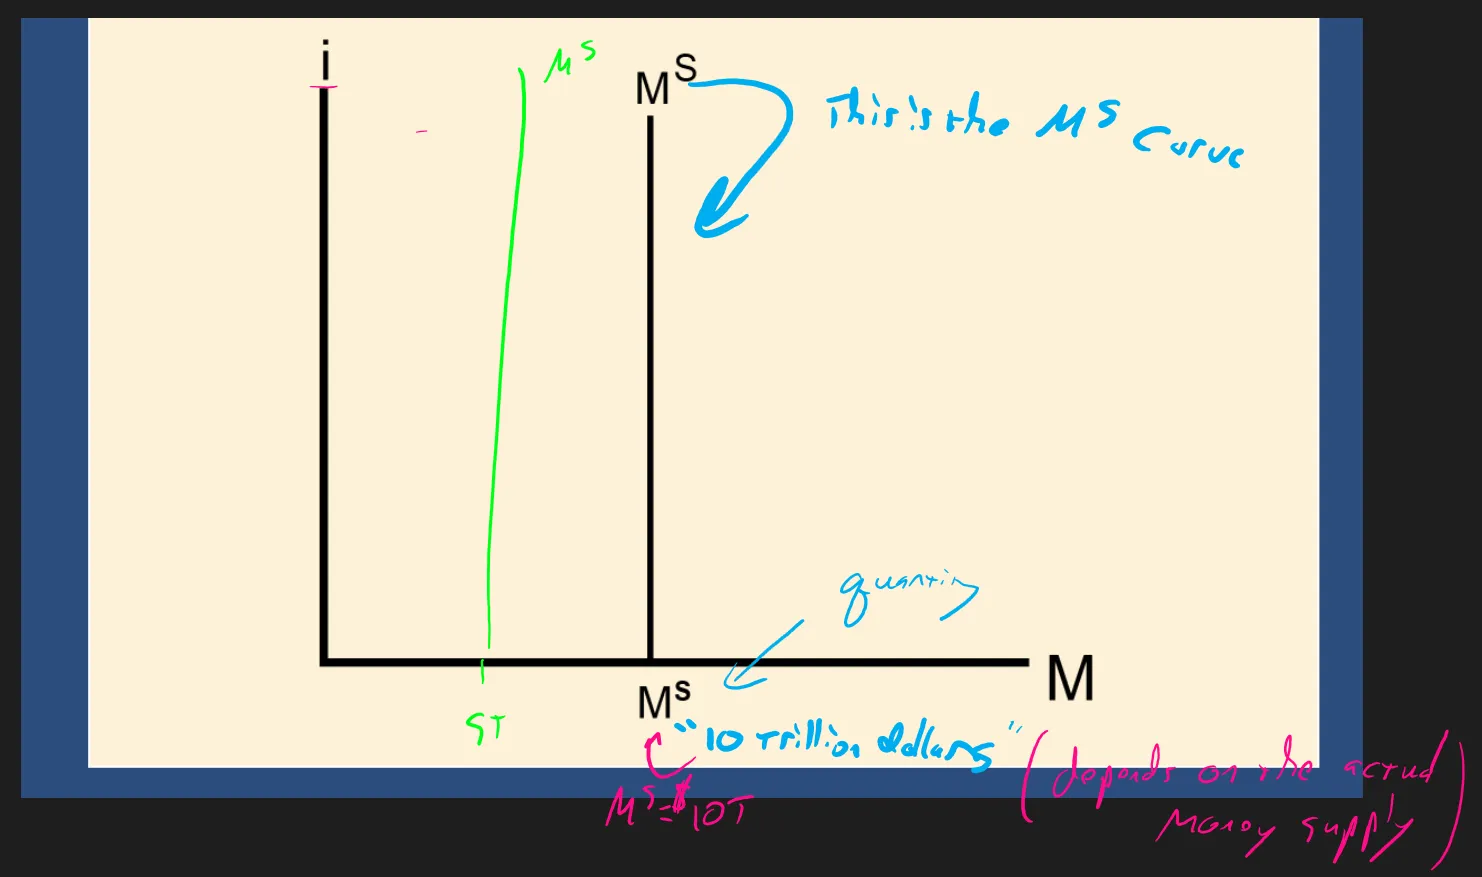
✔ The short answer is that in one of the lectures, Bruce described how to draw a money supply curve. You’ll want to do a diagram like he did, making sure to label all the things that he labeled, including the monetary value of the money supply. If you get stuck, rewatching that portion of the lecture can be helpful.
🕣
❔ Can you use the same formula for figuring out bank reserves to find out the reserves held in the banking system? For example… can I use Total Reserves (R+E) x Deposits and just use the money supply for deposits? I just got a little confused because a lot of our formulas say change in deposits or change in money supply but not actual money supply. Could I also ignore the “change” aspect of this formula and just use change in money supply=change in deposits=(initial change in reserves) x (money multiplier). Or would that not work because it has to be “change” in reserves and not just the reserves?
✔ The short answer is that, if I am understanding you correctly, yes, you can use the money multiplier equation to relate total reserves in the economy to total deposits in the economy.
🕣 7:50pm
❔ Are “total deposits in the economy” the same as “money supply”?
✔
🕣 7:53pm
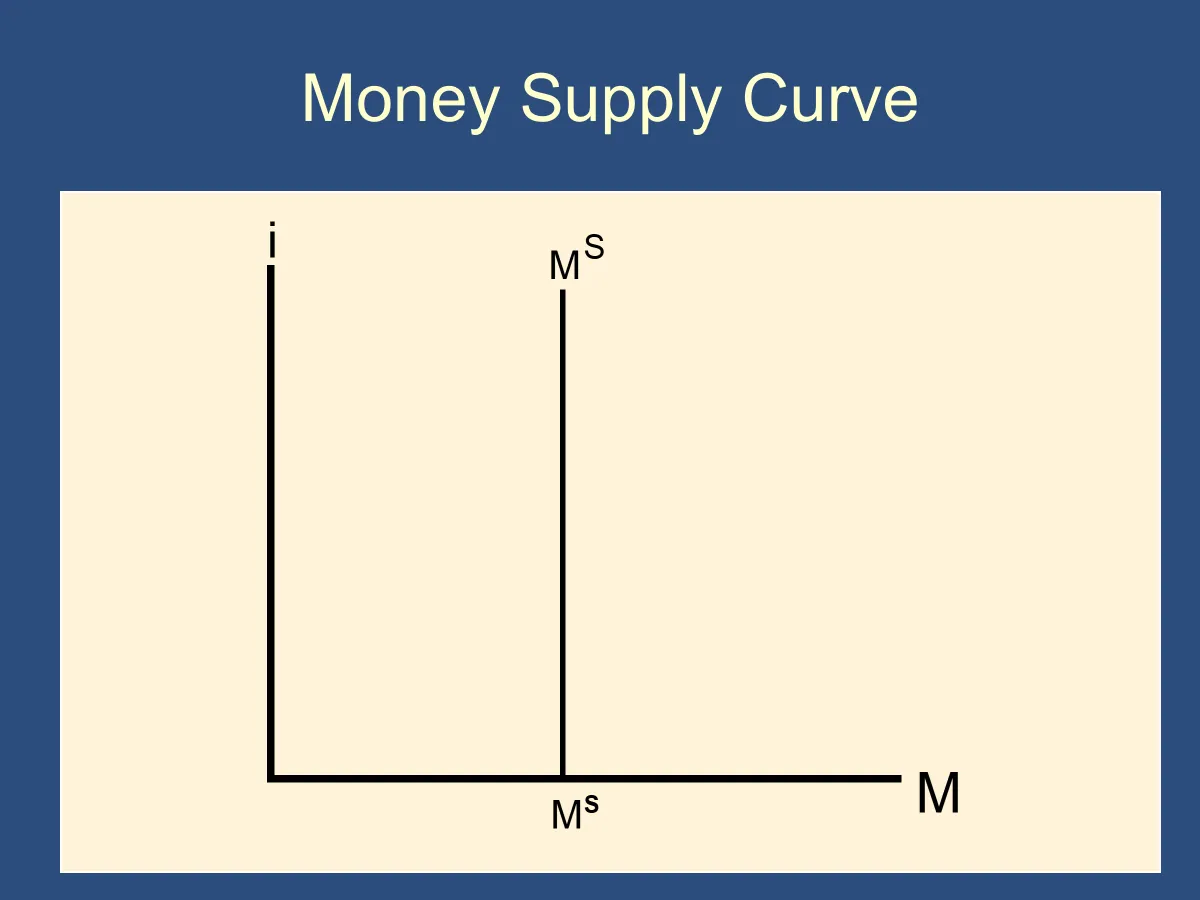
❔ What is a money supply curve?
✔ A supply curve tells you the amount of money that people will want to hold for any given interest rate. The interest rate is the price of borrowing money. If the interest rates are low, then people will borrow more money and save less money. Therefore, the demand curve for money is downward sloping. In contrast, the supply curve for money does not depend on the interest rate. The same amount of money will be supplied independent of the interest rate. As a result, the money supply curve will be vertical.
🕣 7:56pm
❔ What does it mean for a supply curve to be fully labeled?
✔ Generally, for any diagram with coordinate axes, you should label the two axes.
To show the relationship between the interest rate and how much money people will hold, you need to have money on one axis and interest rate on another.
In a supply and demand diagram, the price is always on the vertical axis and the quantity is on the X axis. Therefore, it always has interest rate on the vertical axis and quantity of money on the horizontal.
In conclusion: i on Y axis and M on the X axis.
Label the diagram: money supply
draw and label the money supply curve.
Generally, a money supply curve will be vertical, because a specific amount of money will exist (ie be suppleid) in the economy. For a diagram to be fully labeled, you should also label that quantity of money.
🕣
❔ Can you use your two money supply equations with total amounts rather than changes?
Ie, instead of
Can we use:
✔ Yes. First,
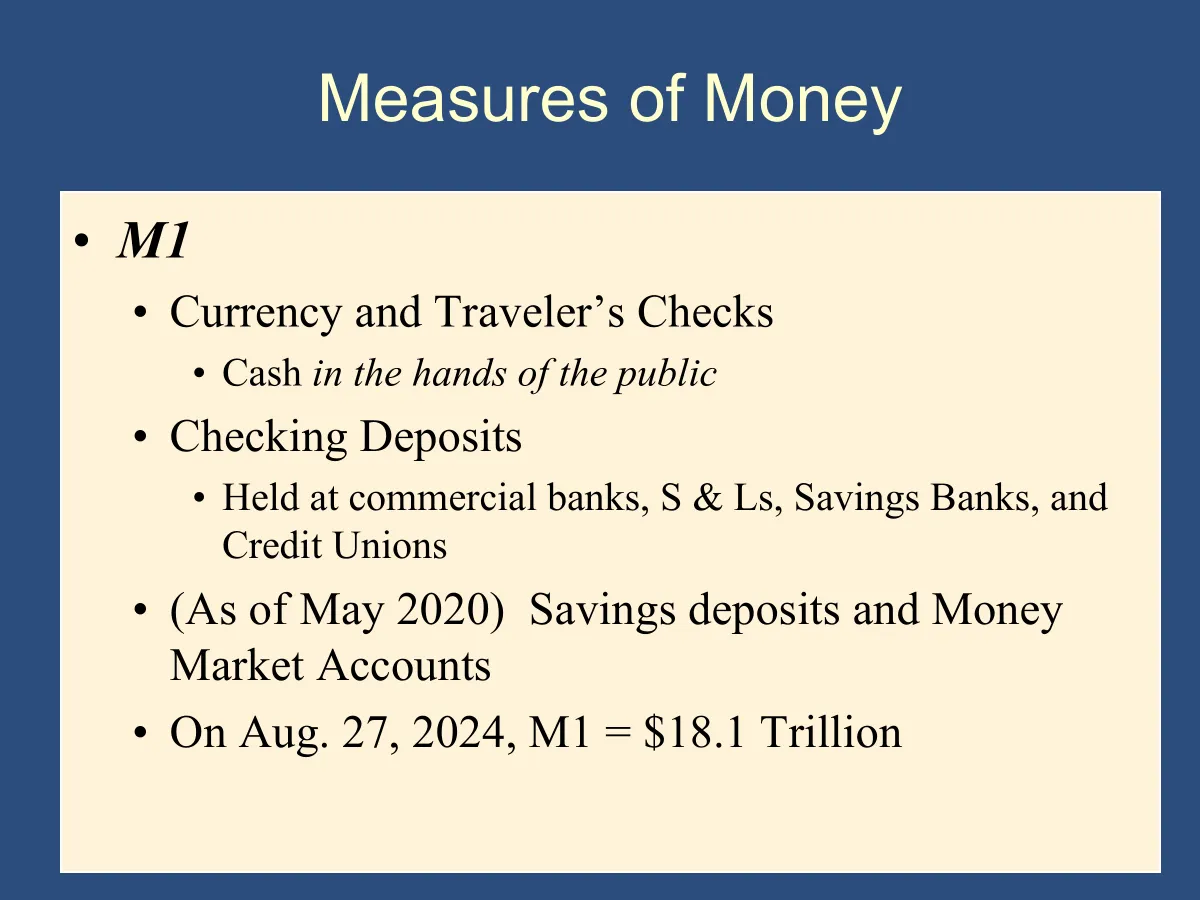
must be true because it is the definition of M1.
Yes, the money multiplier equation works for totals as well:
You can use these equations as they are.
Feedback? Email rob.mgmte2000@gmail.com 📧. Be sure to mention the page you are responding to.