👨🏫 Outline
Formulas for this lecture can be found in my paper formula sheets and online formula sheet.
Overview
This page provides a detailed outline of this week’s lecture. In it, Bruce covered three main topics:
In addition to those three main topics, he also covered how the Balance Sheet must balance.
Formulas
This page/lecture covers the following formulas:
10% = 1% × 10
Measures of Bank Profitability
3 Net Interest Measures:
- Net Interest Spread
- Net Interest Income
- Net Interest Margin
2 Profitability ratios:
- Return on Assets (ROA)
- Return on Equity (ROE)
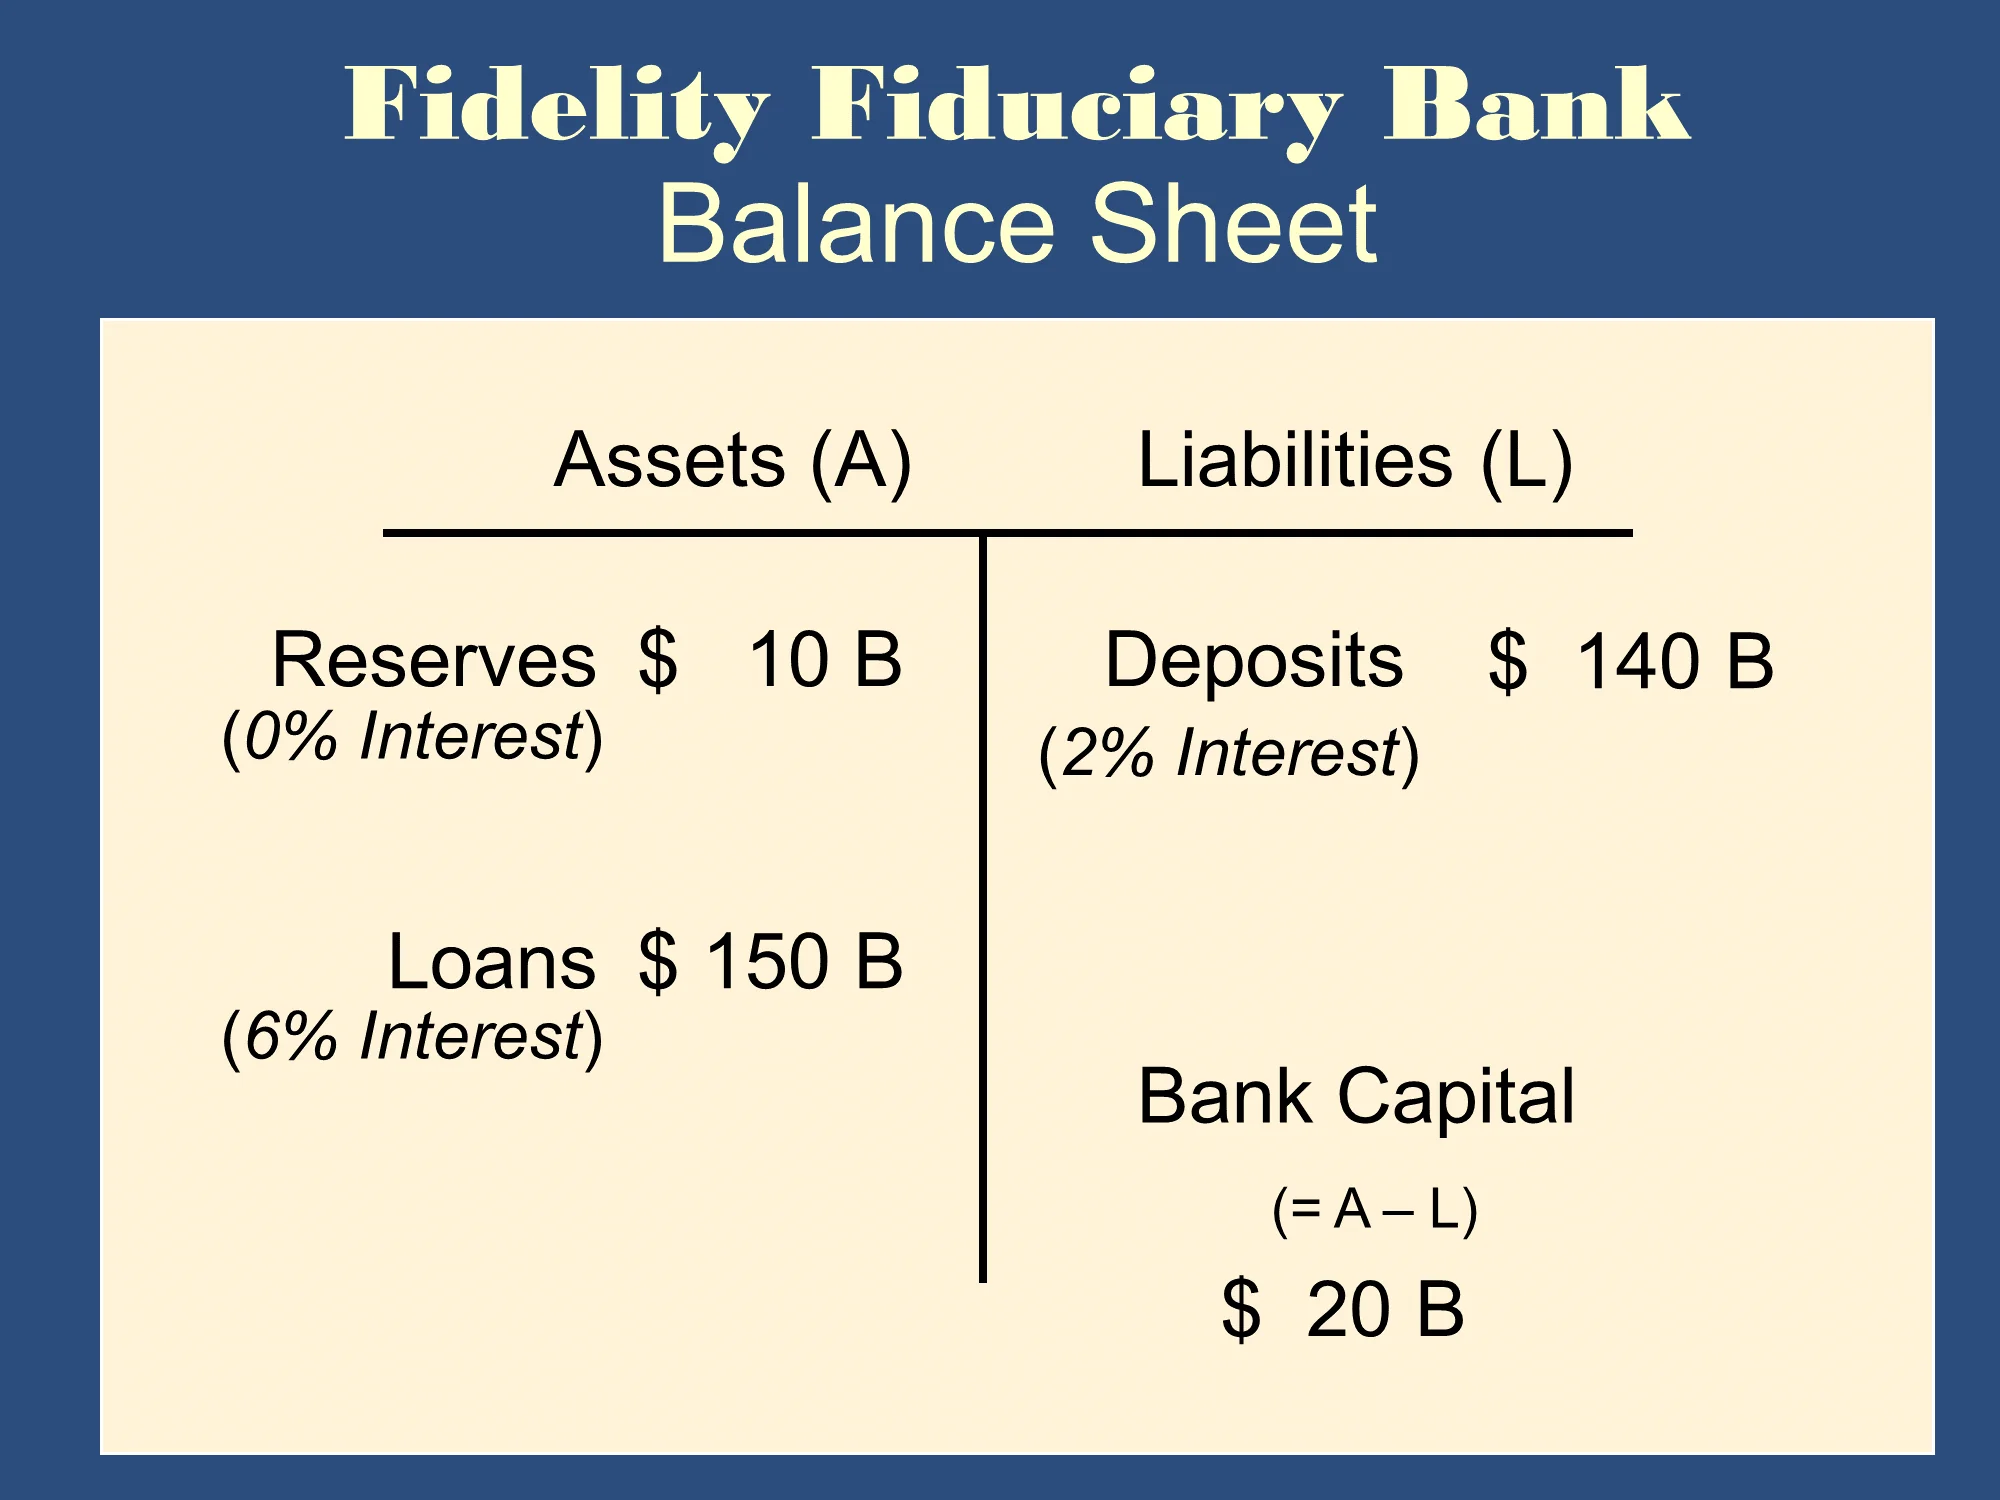
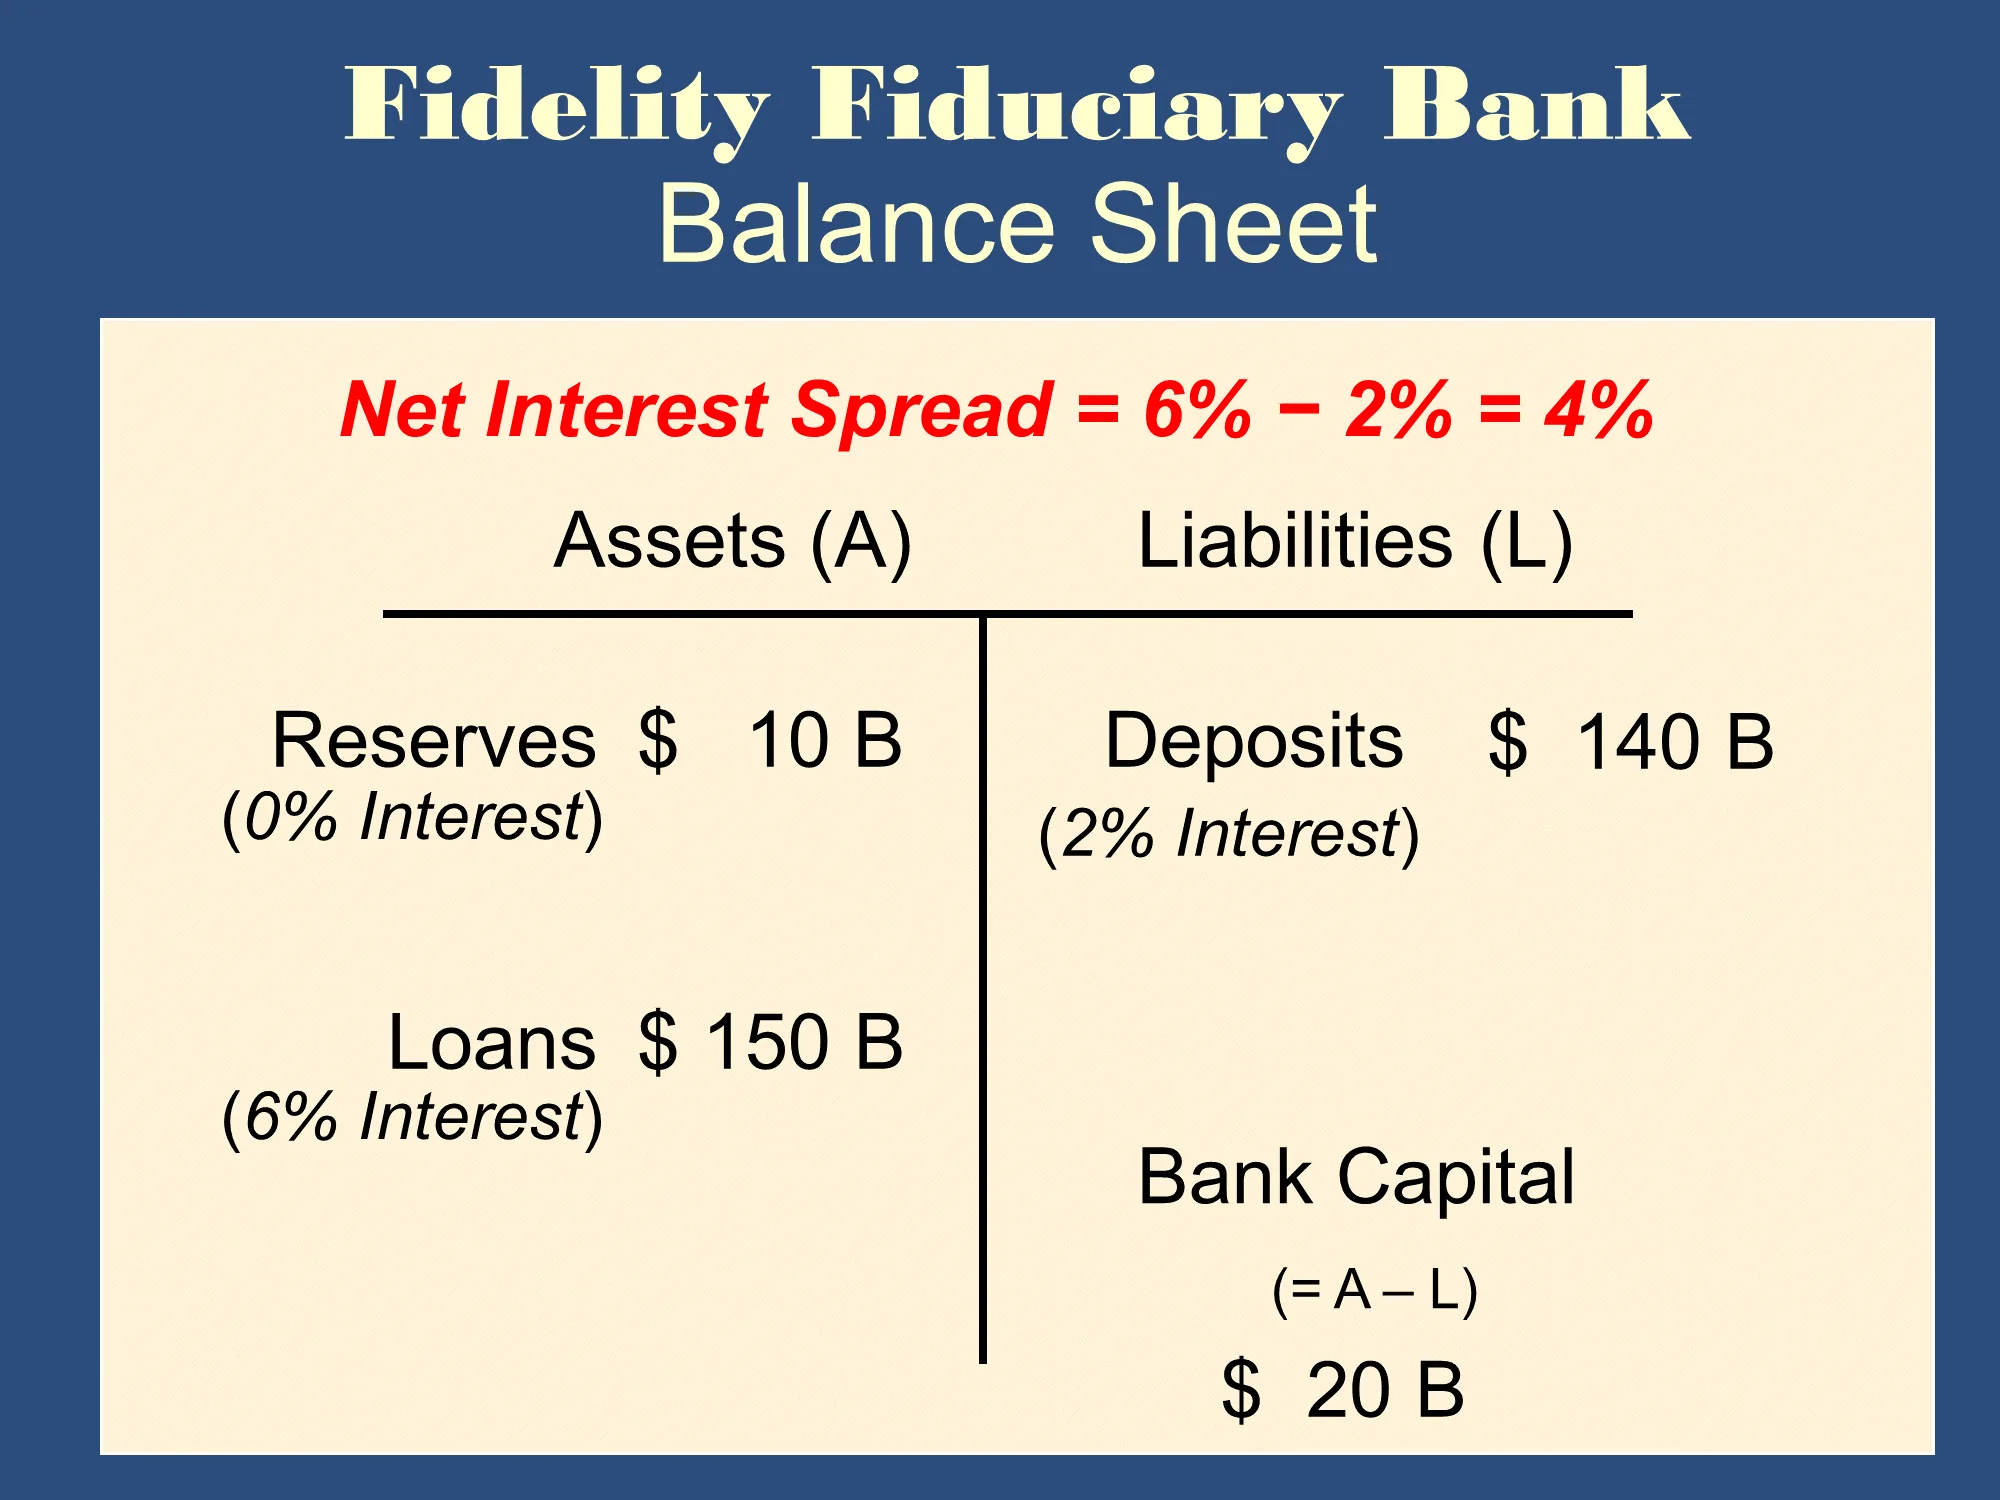
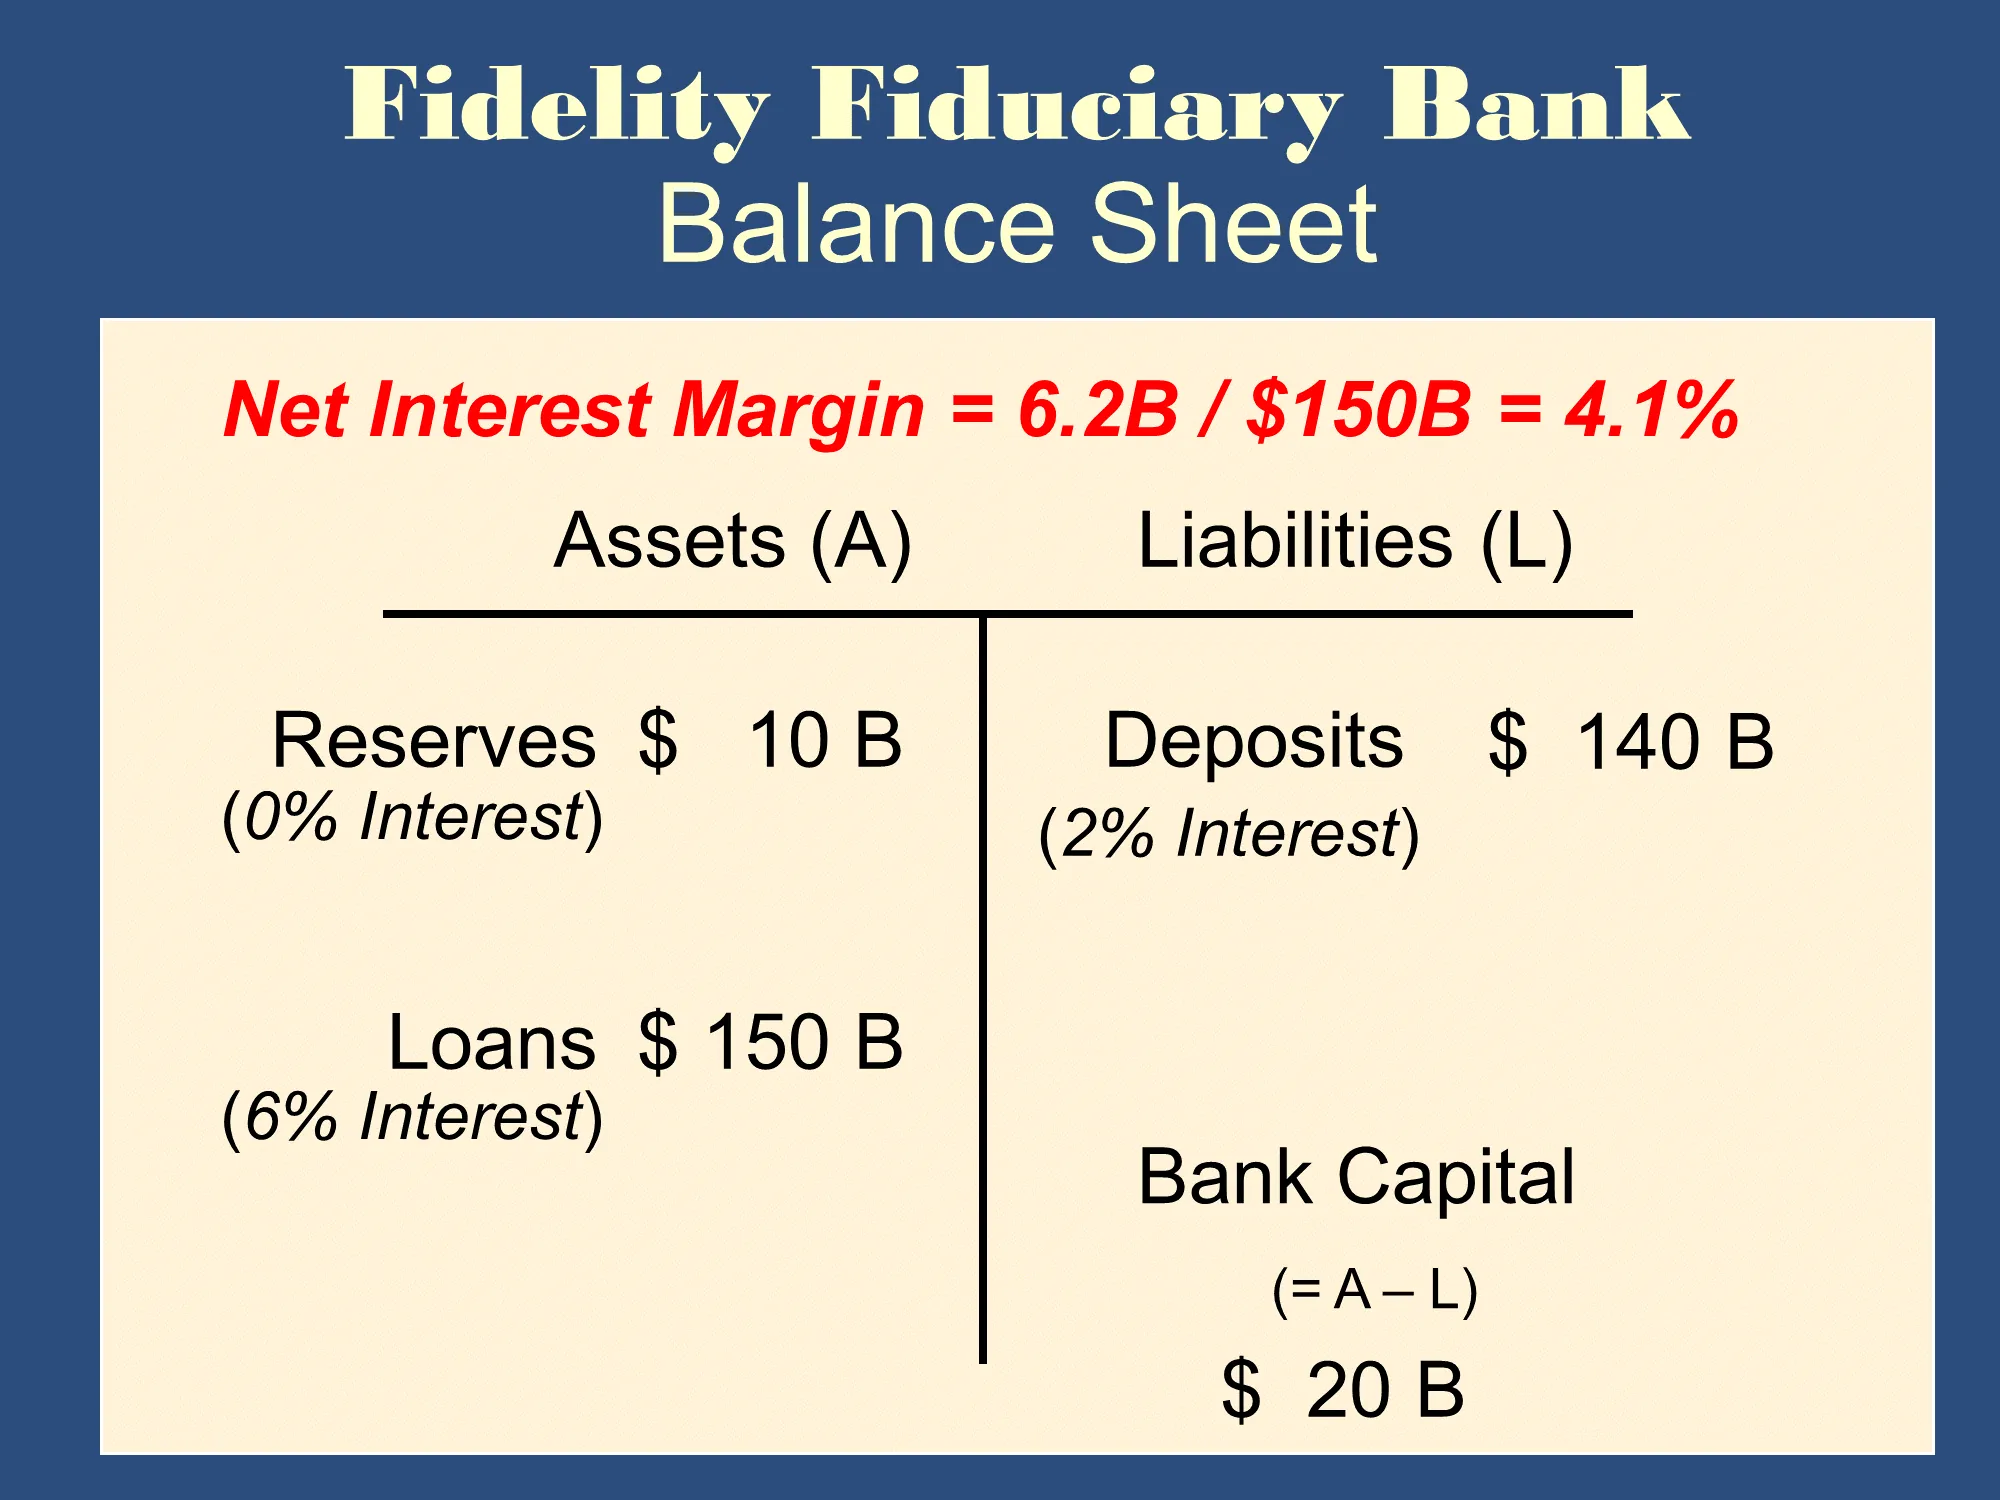
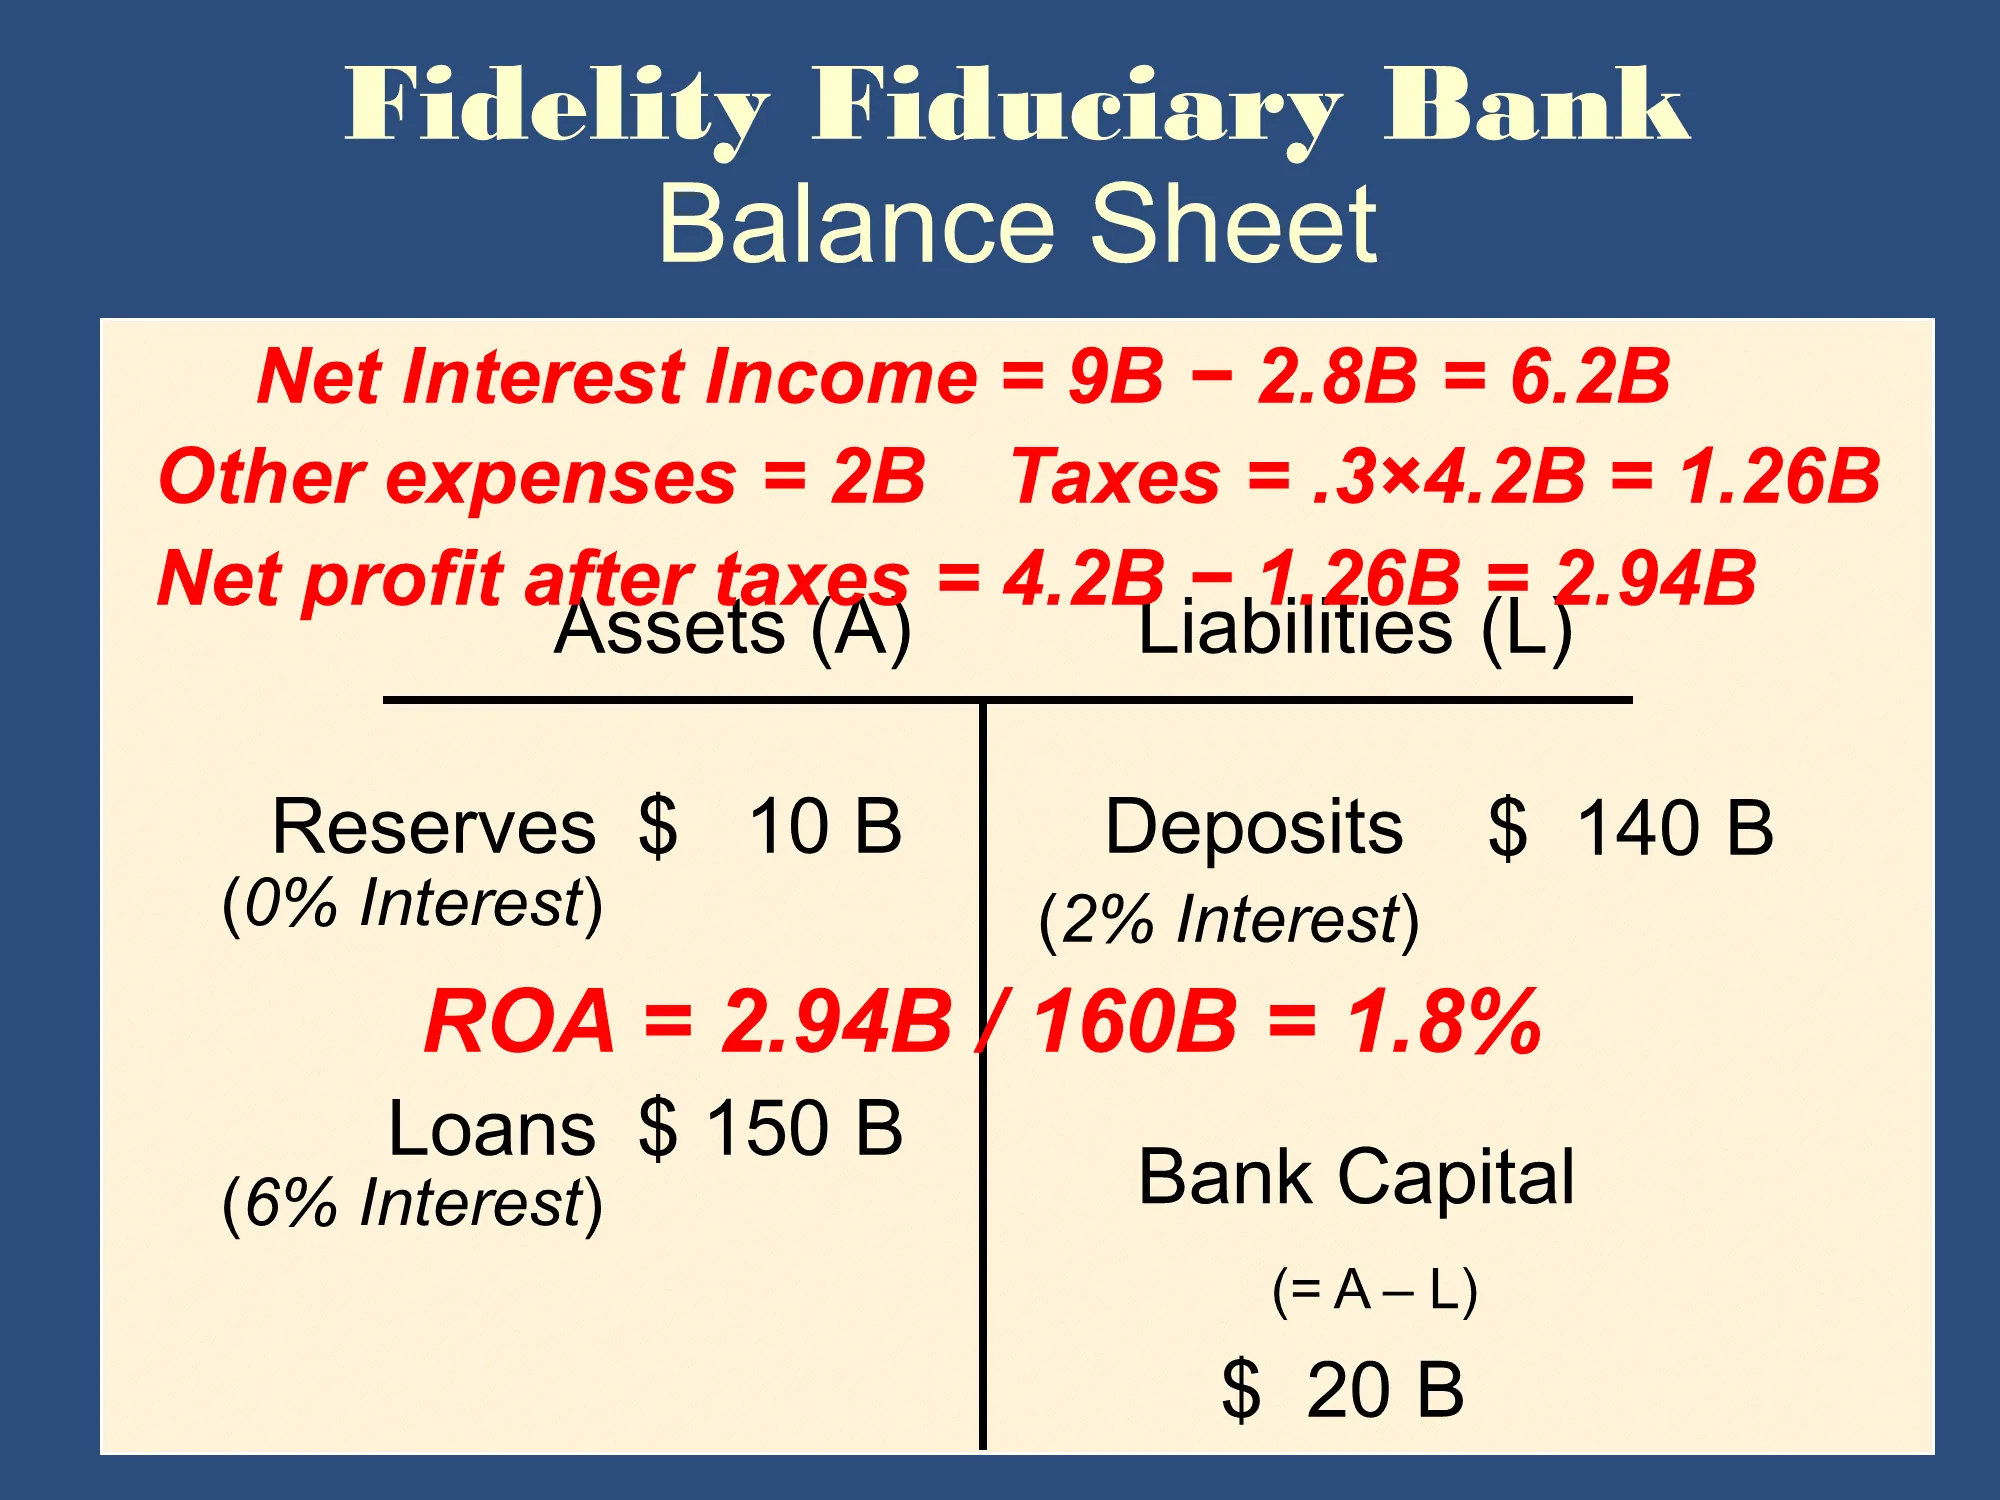
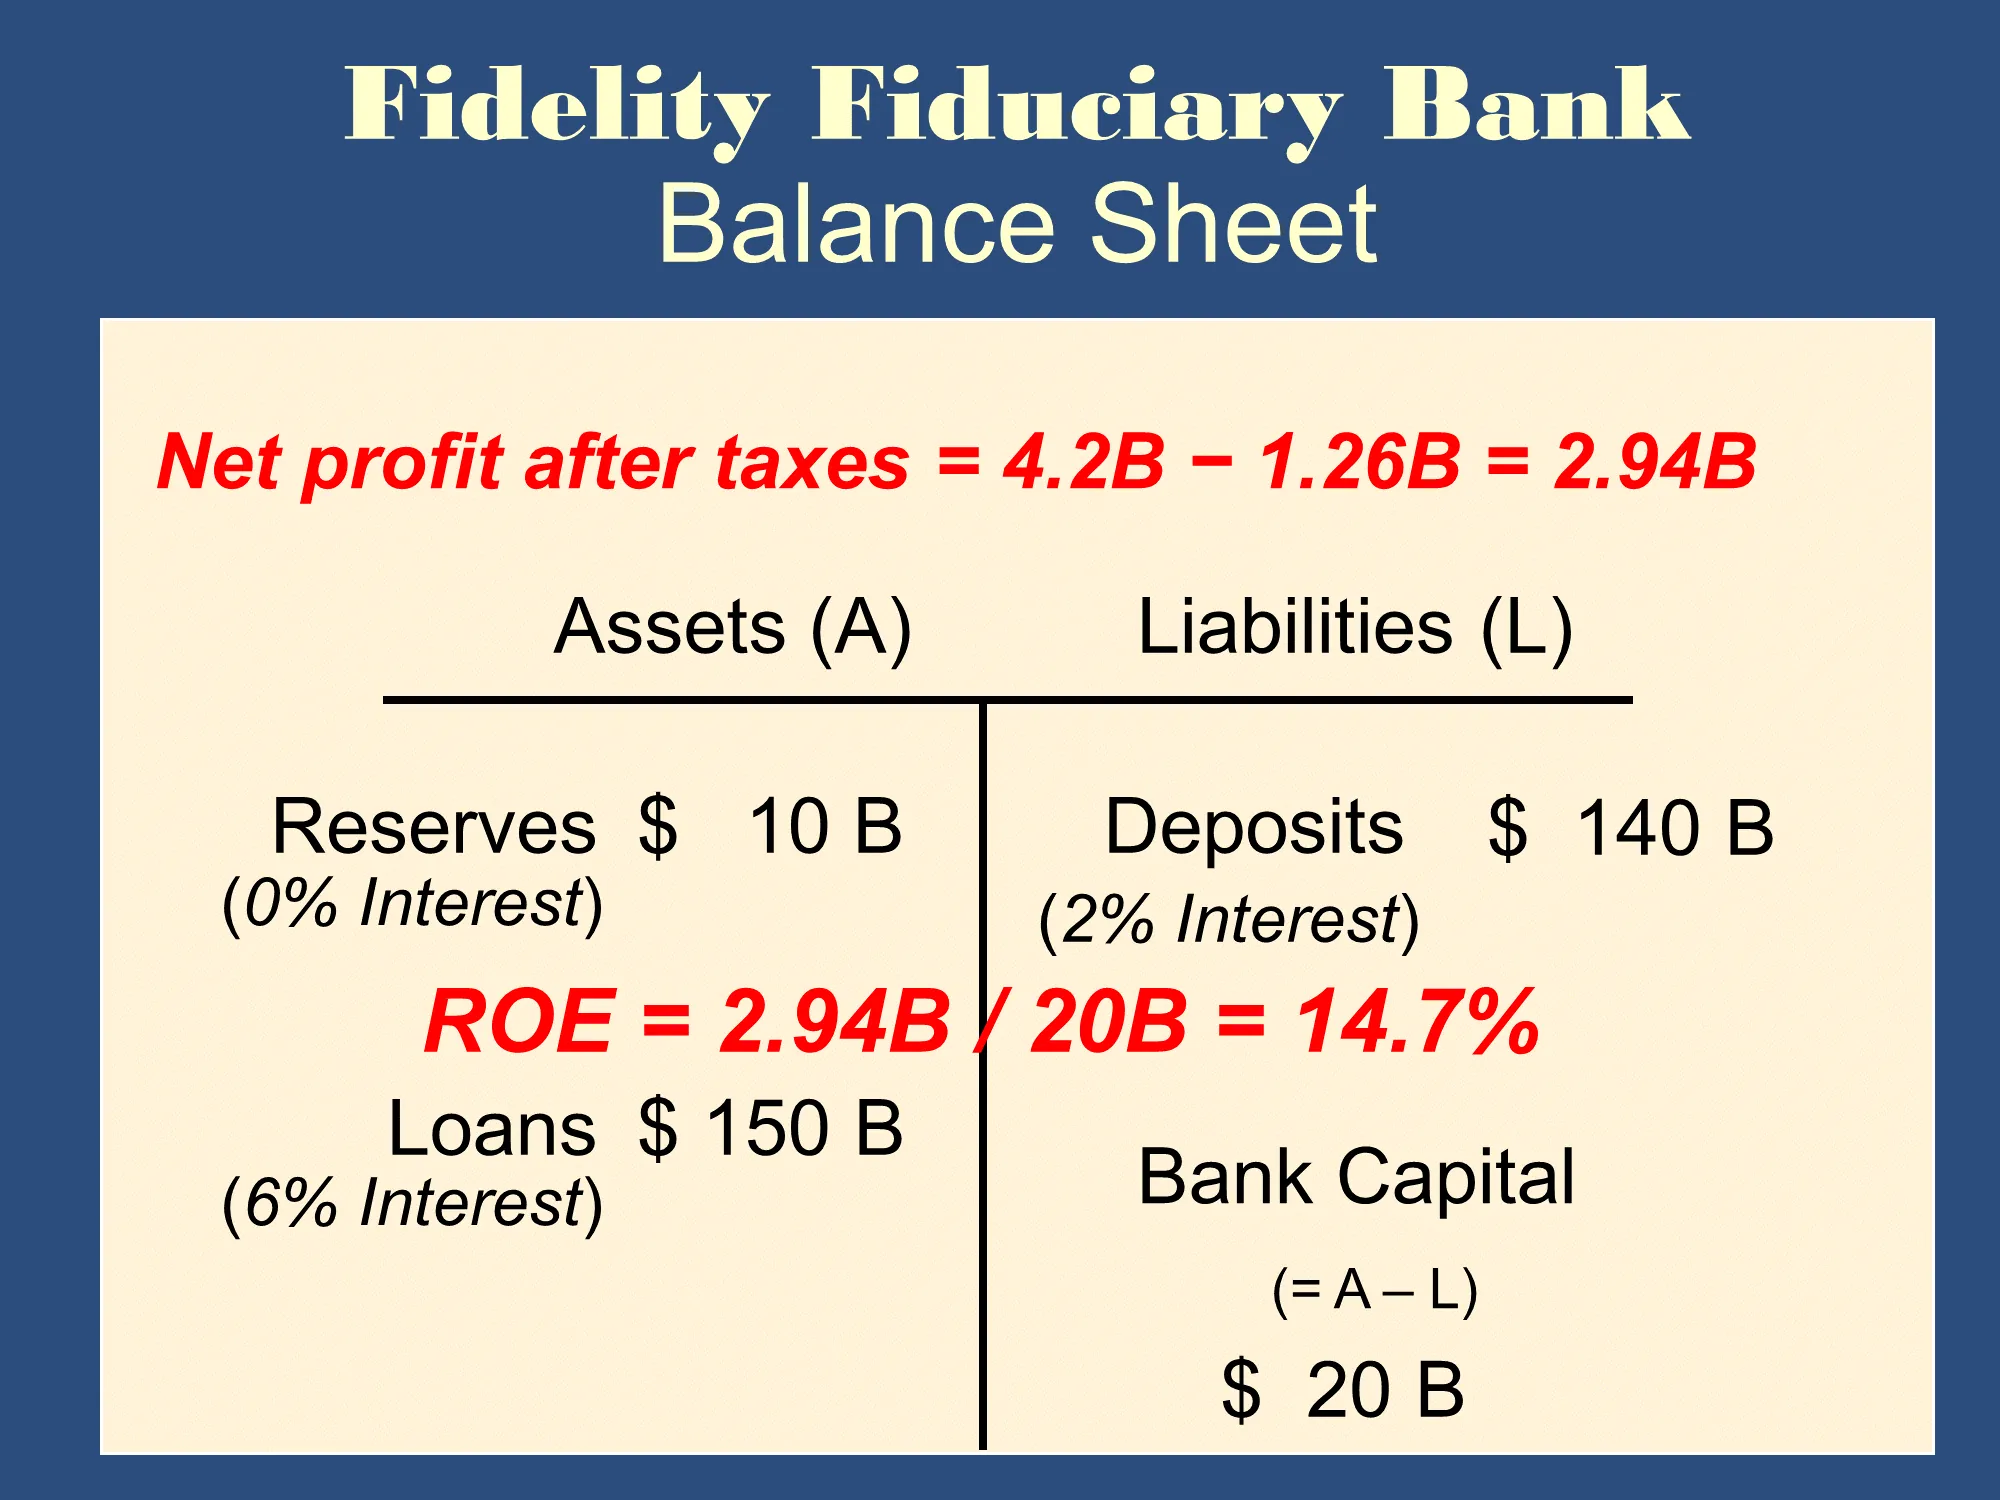
Bruce used a continuing example of Fidelity Fiduciary Bank
Net Interest Spread
- Difference between the rate which banks earn on their assets and the rate which they have to pay on their liabilities (for example, the rate they pay on deposits)
- Does not account for the fact that the total amount of interest earning assets and the total amount of liabilities is different
✏️ What is the Net Interest Spread for Fidelity Fiduciary Bank? Use the data above.
✔ Click here to view answer
Net Interest Income
- Difference between total interest payments received on a bank’s assets and the total interest payments made on the bank’s liabilities
- Net interest income = (total interest received on assets) - (total interest payments on liabilities)

Net Interest Margin
- Well-run banks have a high net interest income and a high net interest margin.
- If a bank’s net interest margin is currently improving, its profitability is likely to improve in the future.
Return On Assets (ROA)
- ROA is the bank’s profit left after taxes divided by the bank’s total assets.
- It is a measure of how efficiently a particular banks uses its assets.
- This is less important to bank owners than the return on their own investment.
✏️ Suppose a bank has assets of $200M. It’s most recent profit after taxes $1.8M. What is its ROA?
✔ Click here to view answer
Return On Equity (ROE)
- The bank’s return to its owners is measured by the ROE. This is the bank’s net profit after taxes divided by the bank’s capital.
- ROA and ROE are related to leverage.
✏️ Suppose a bank has Bank Capital of $18M. It’s most recent profit after taxes $1.8M. What is its ROE?
✔ Click here to view answer
ROE = ROA × Leverage Ratio
Immediately below, Bruce introduces the concept of the Leverage Ratio:
There is a helpful formula that you can use to check your work on problems like this:
Here is an example of using the formula:
✏️ Use ROE = ROA × Leverage to check your answers in the three problems above.
✔ Click here to view answer
ROA = .9%
ROE = 10%
A more challenging problem
✏️ Suppose a bank has assets of $200M. It’s ROA is 1.2%. What was its most recent profit after taxes.
✔ Click here to view answer
If you stuck, you can often solve the problem using “plug and chug.” With some practice, you’ll find it easy!
Plug and chug: (help)
- Equation →
- Plug 🔌 →
- Solve 🚂 →
- 🧠 → seems like a reasonable number.
- ✔ Plug your answers back into the formula:
Profit and Changes in Bank Capital
Leverage, Bank Capital, and Profit
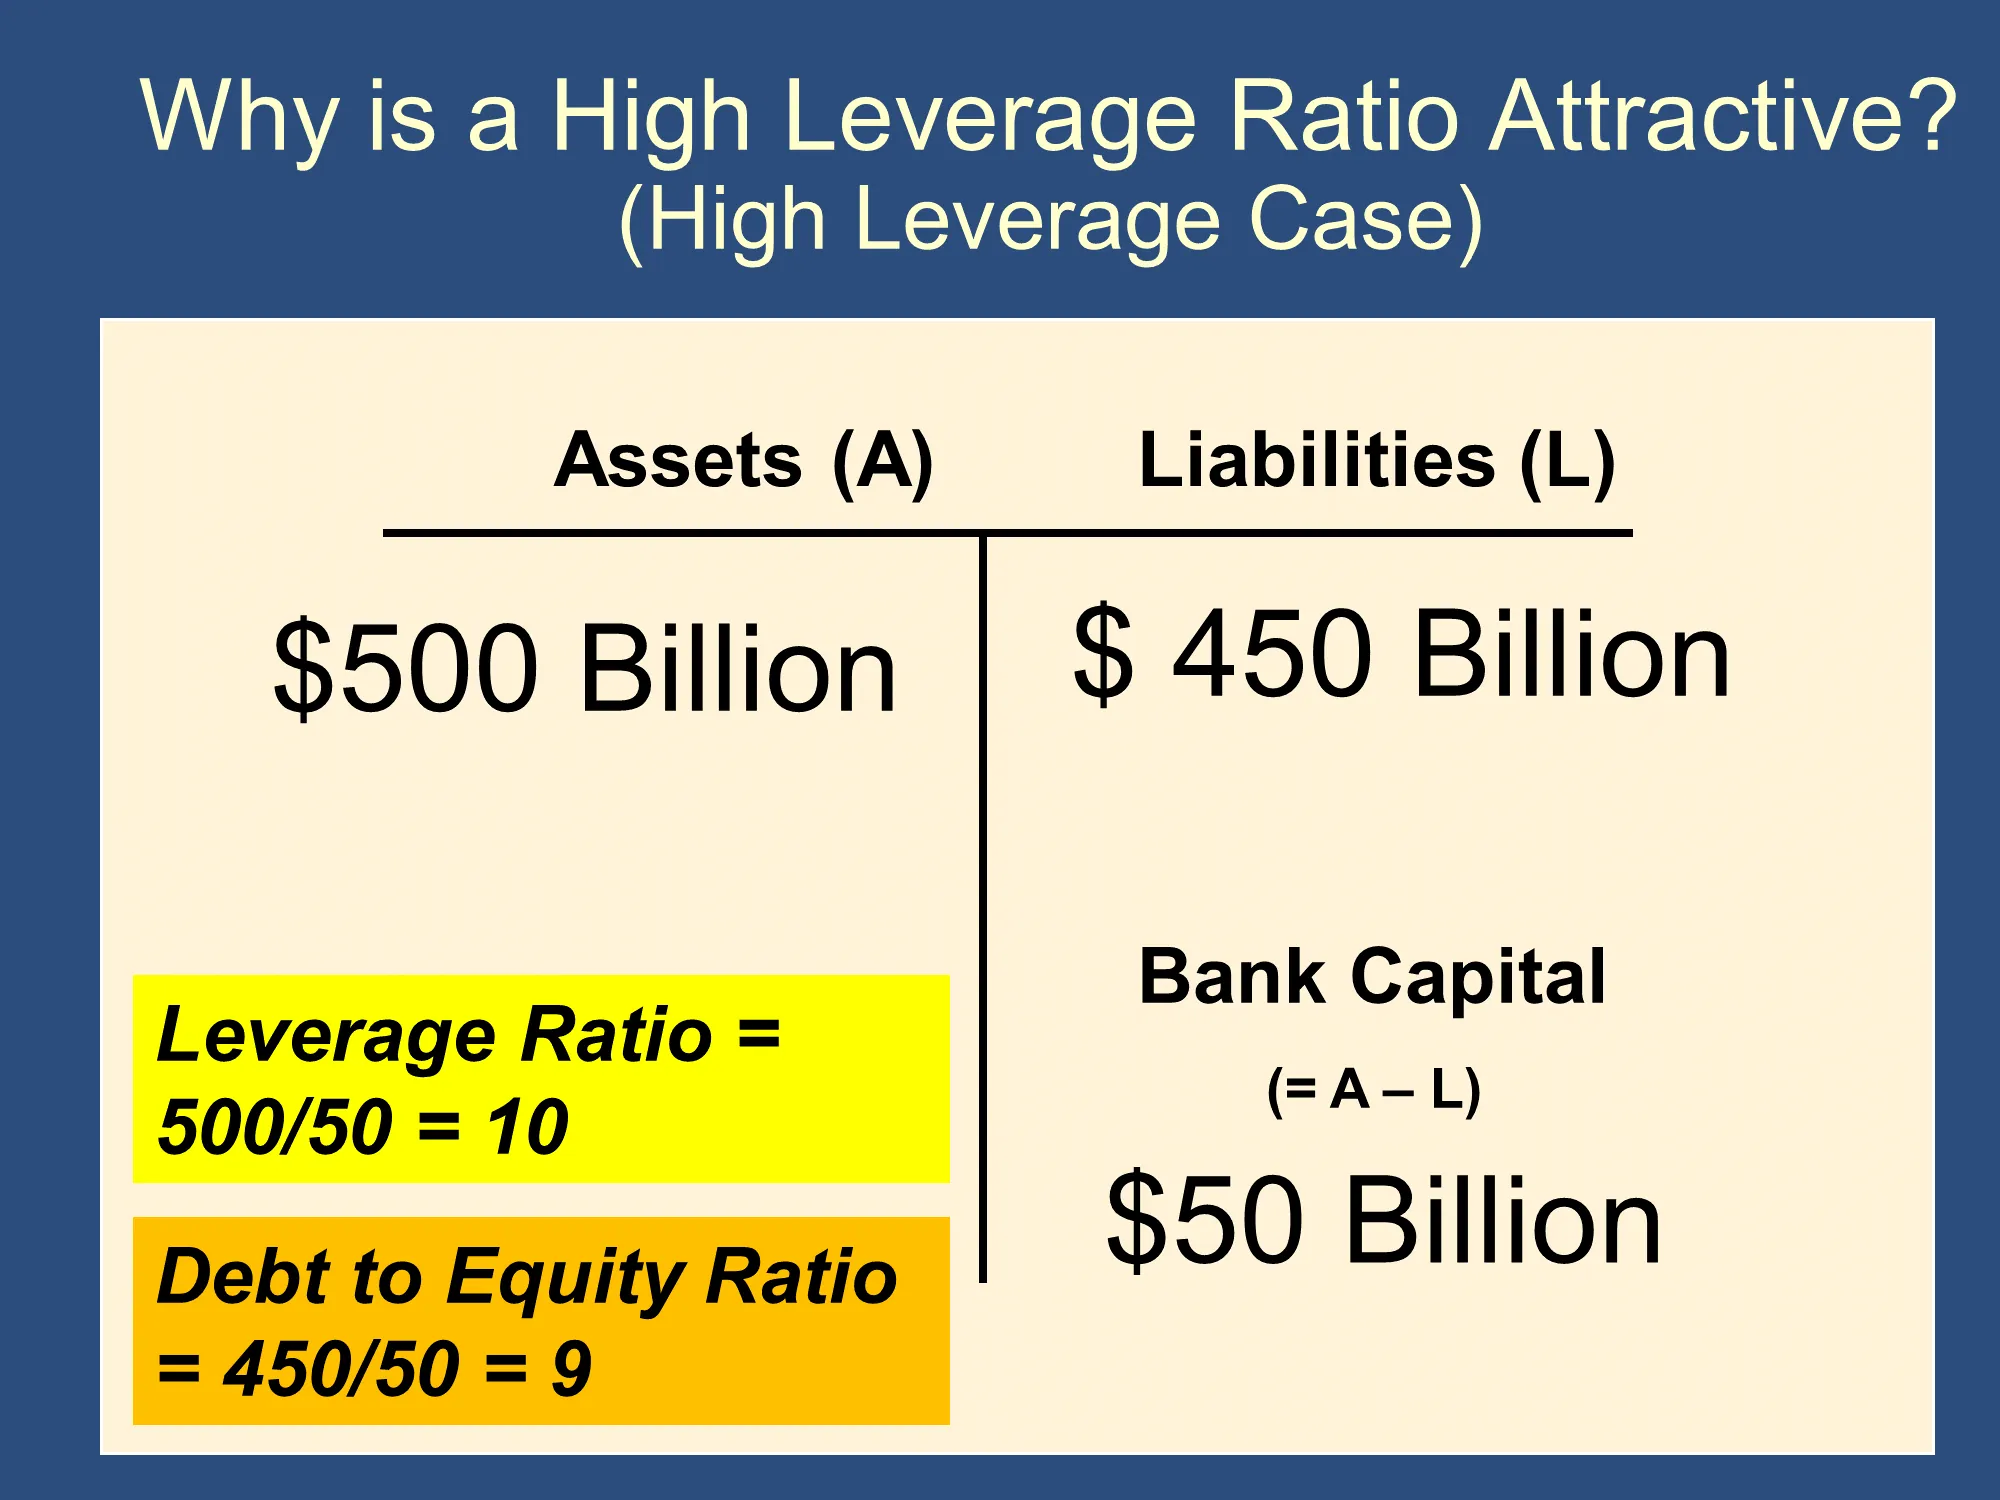
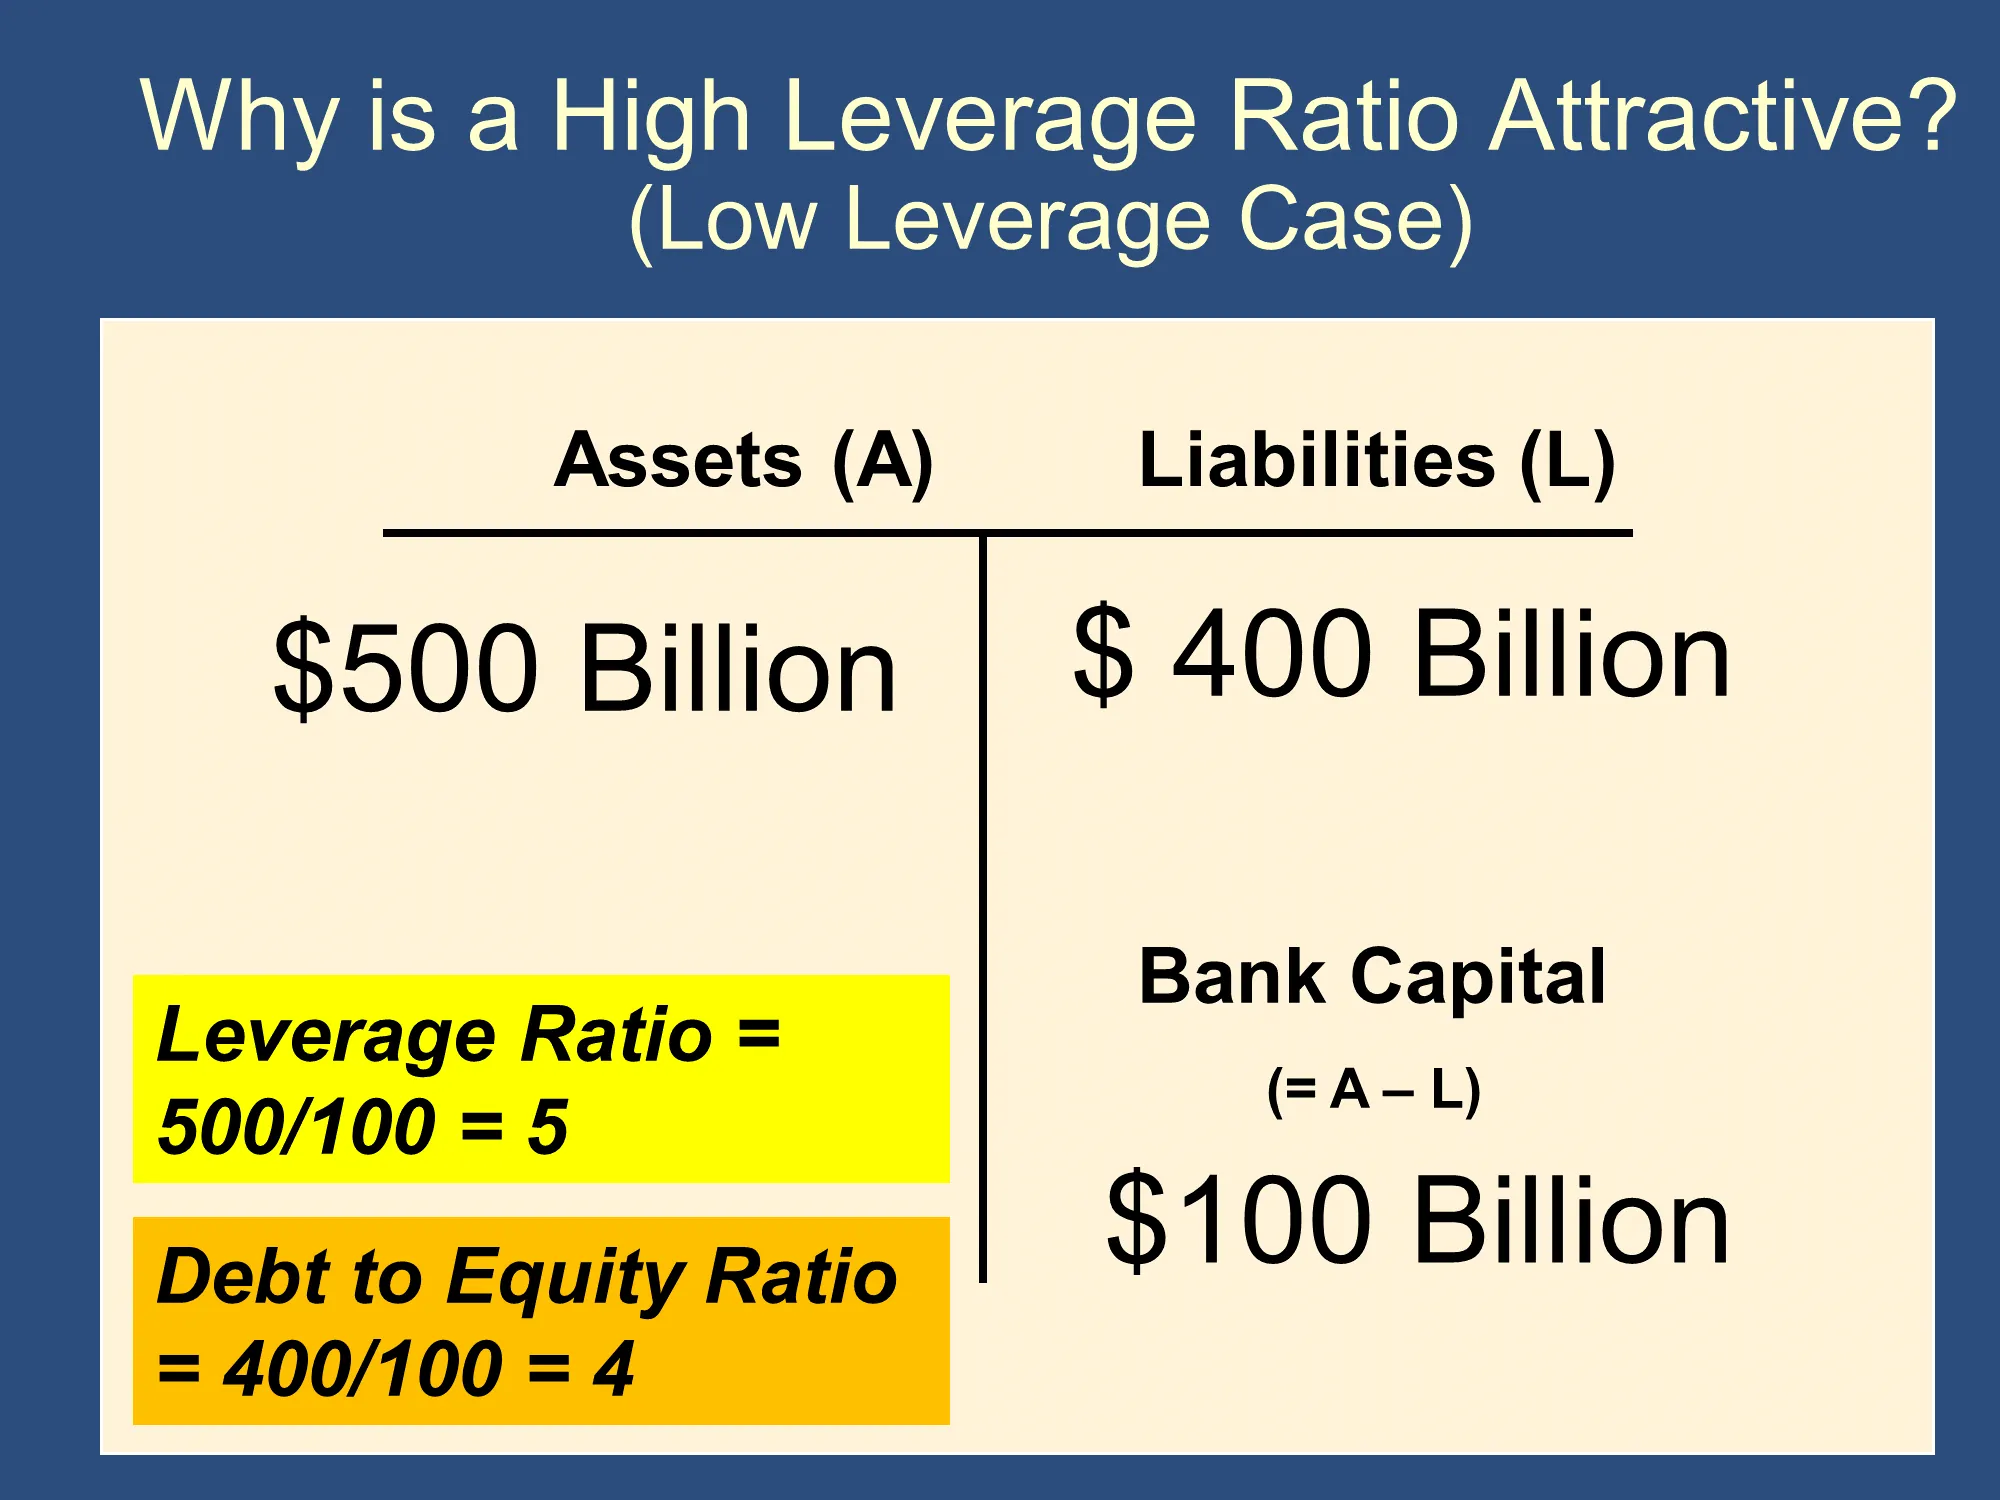
Leverage and Debt to Equity Ratios
- The extent of leverage can also be measured by the bank’s debt to equity ratio:
- (This slide continues below)
Levels of debt and leverage
- Prior to the financial crisis of 2007-2009, the typical U.S. bank has a ROA of about 1.3%.
- For large banks, the ROE tends to be higher than for small banks, suggesting greater leverage, a riskier mix of assets, or the existence of significant economies to scale in banking.
- The poor performance during the crisis and moderate returns after, suggests their high returns were at least partly due to more leverage or a riskier mix of assets.
- The ratio of debt to equity in the U.S. banking system was about 8 to 1 in December, 2015.
- Although that is a substantial amount of leverage, it is nearly 25% below the average commercial bank leverage ratio that prevailed prior to the financial crisis of 2007-2009.
- Debt-to-equity ratio for nonfinancial business in the U.S. is less than 1 to 1.
- Household leverage is roughly 1/3 to 1.
- Leverage increases risk AND expected return.
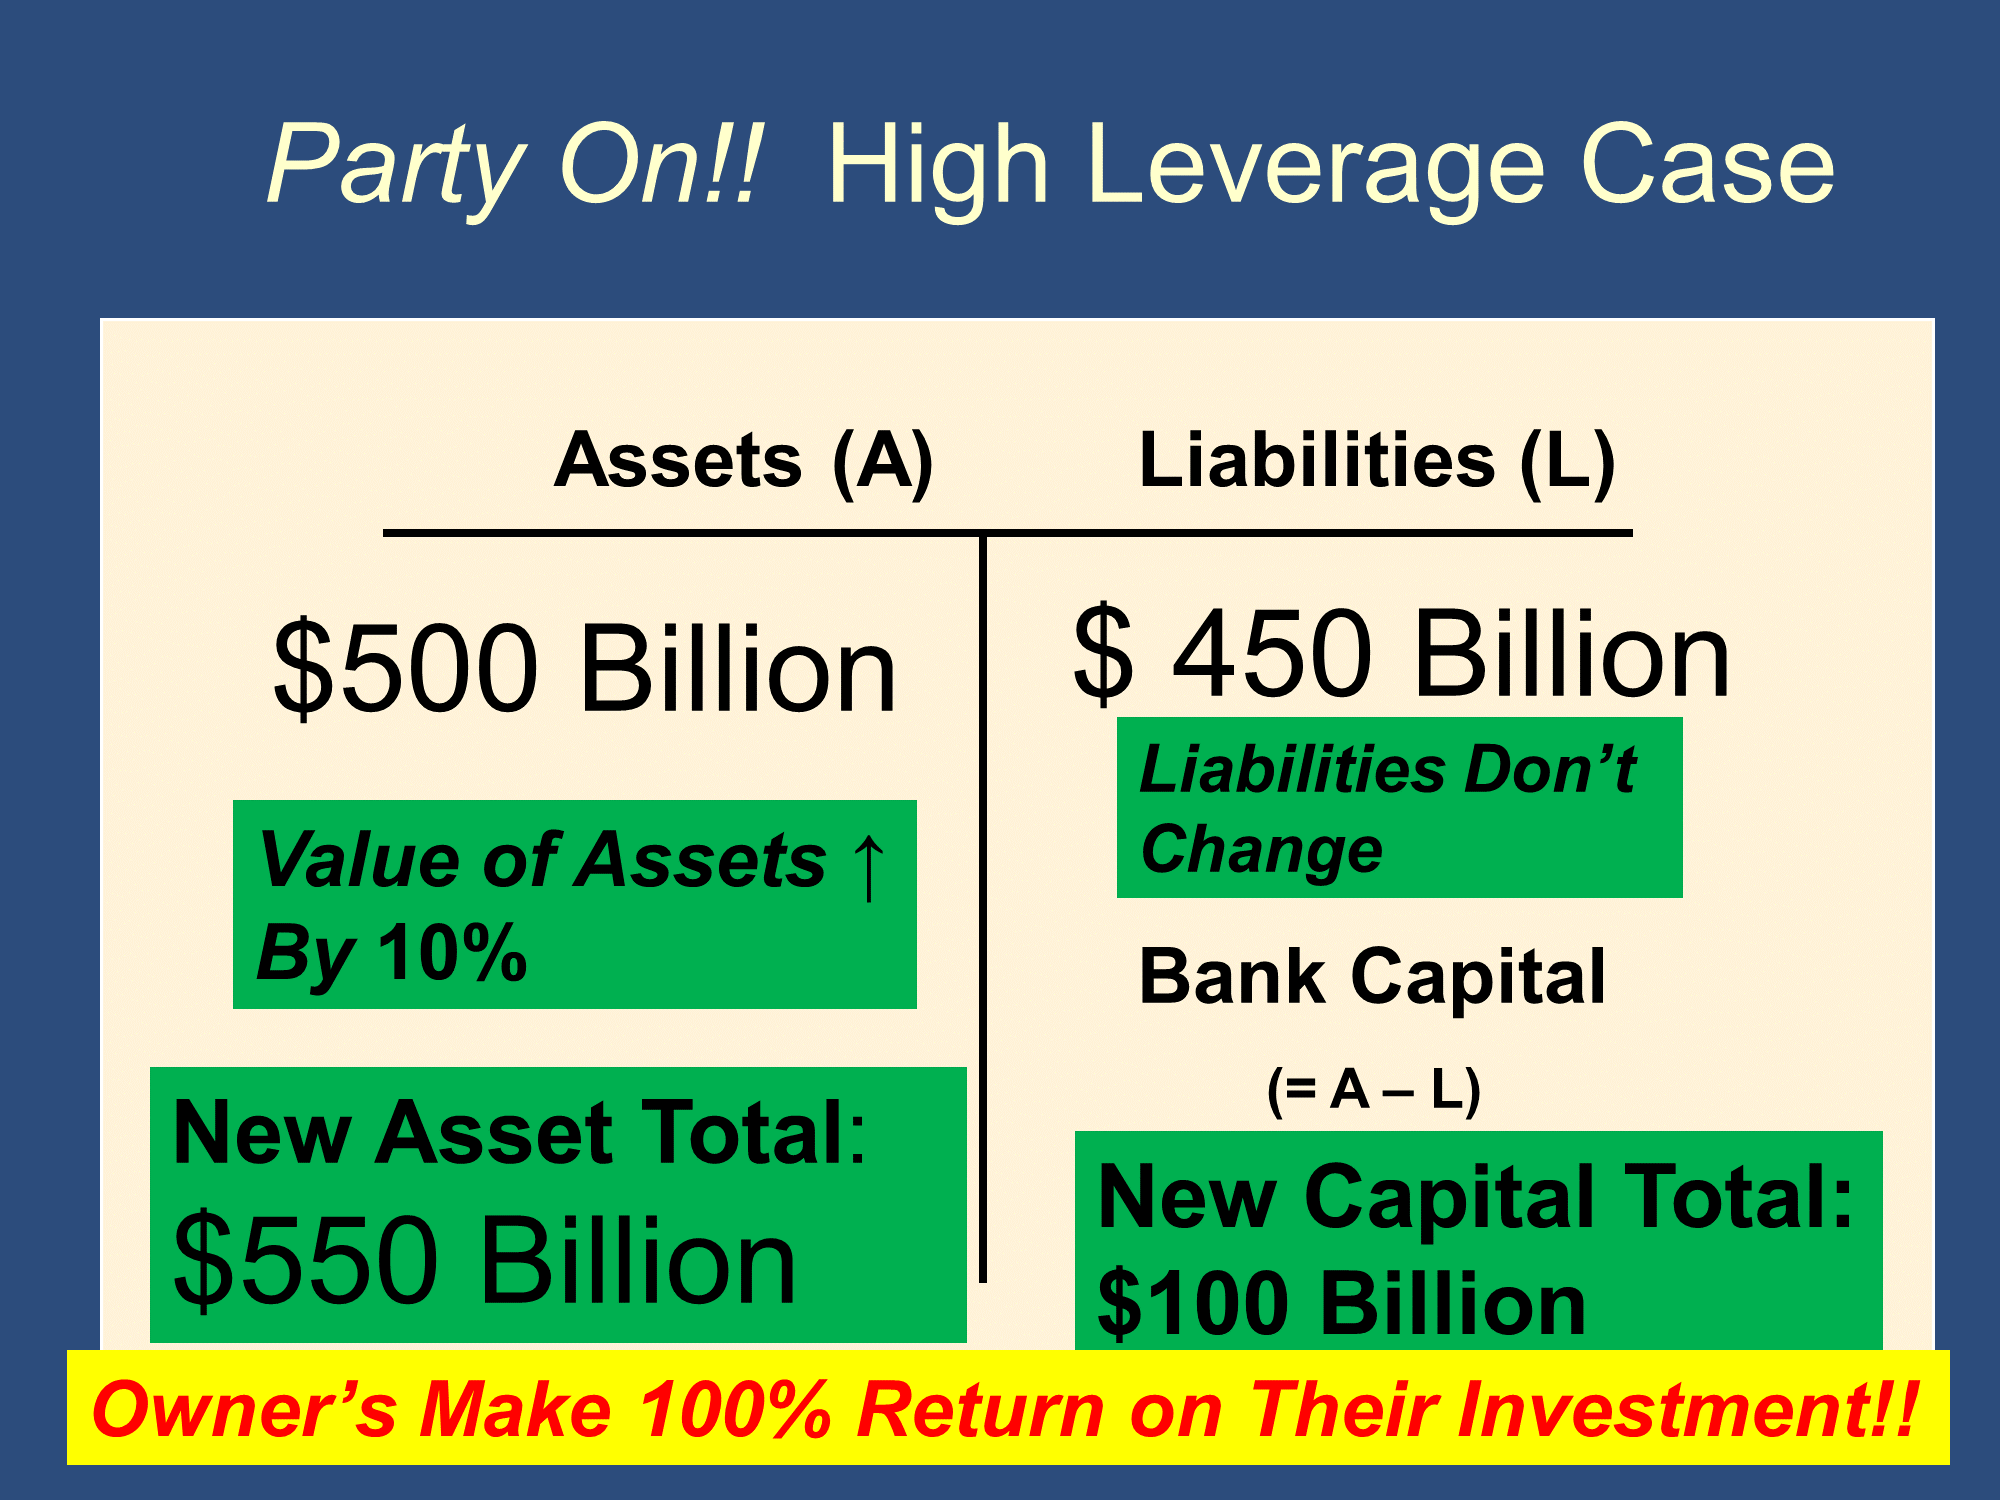
Why is High Leverage Attractive?
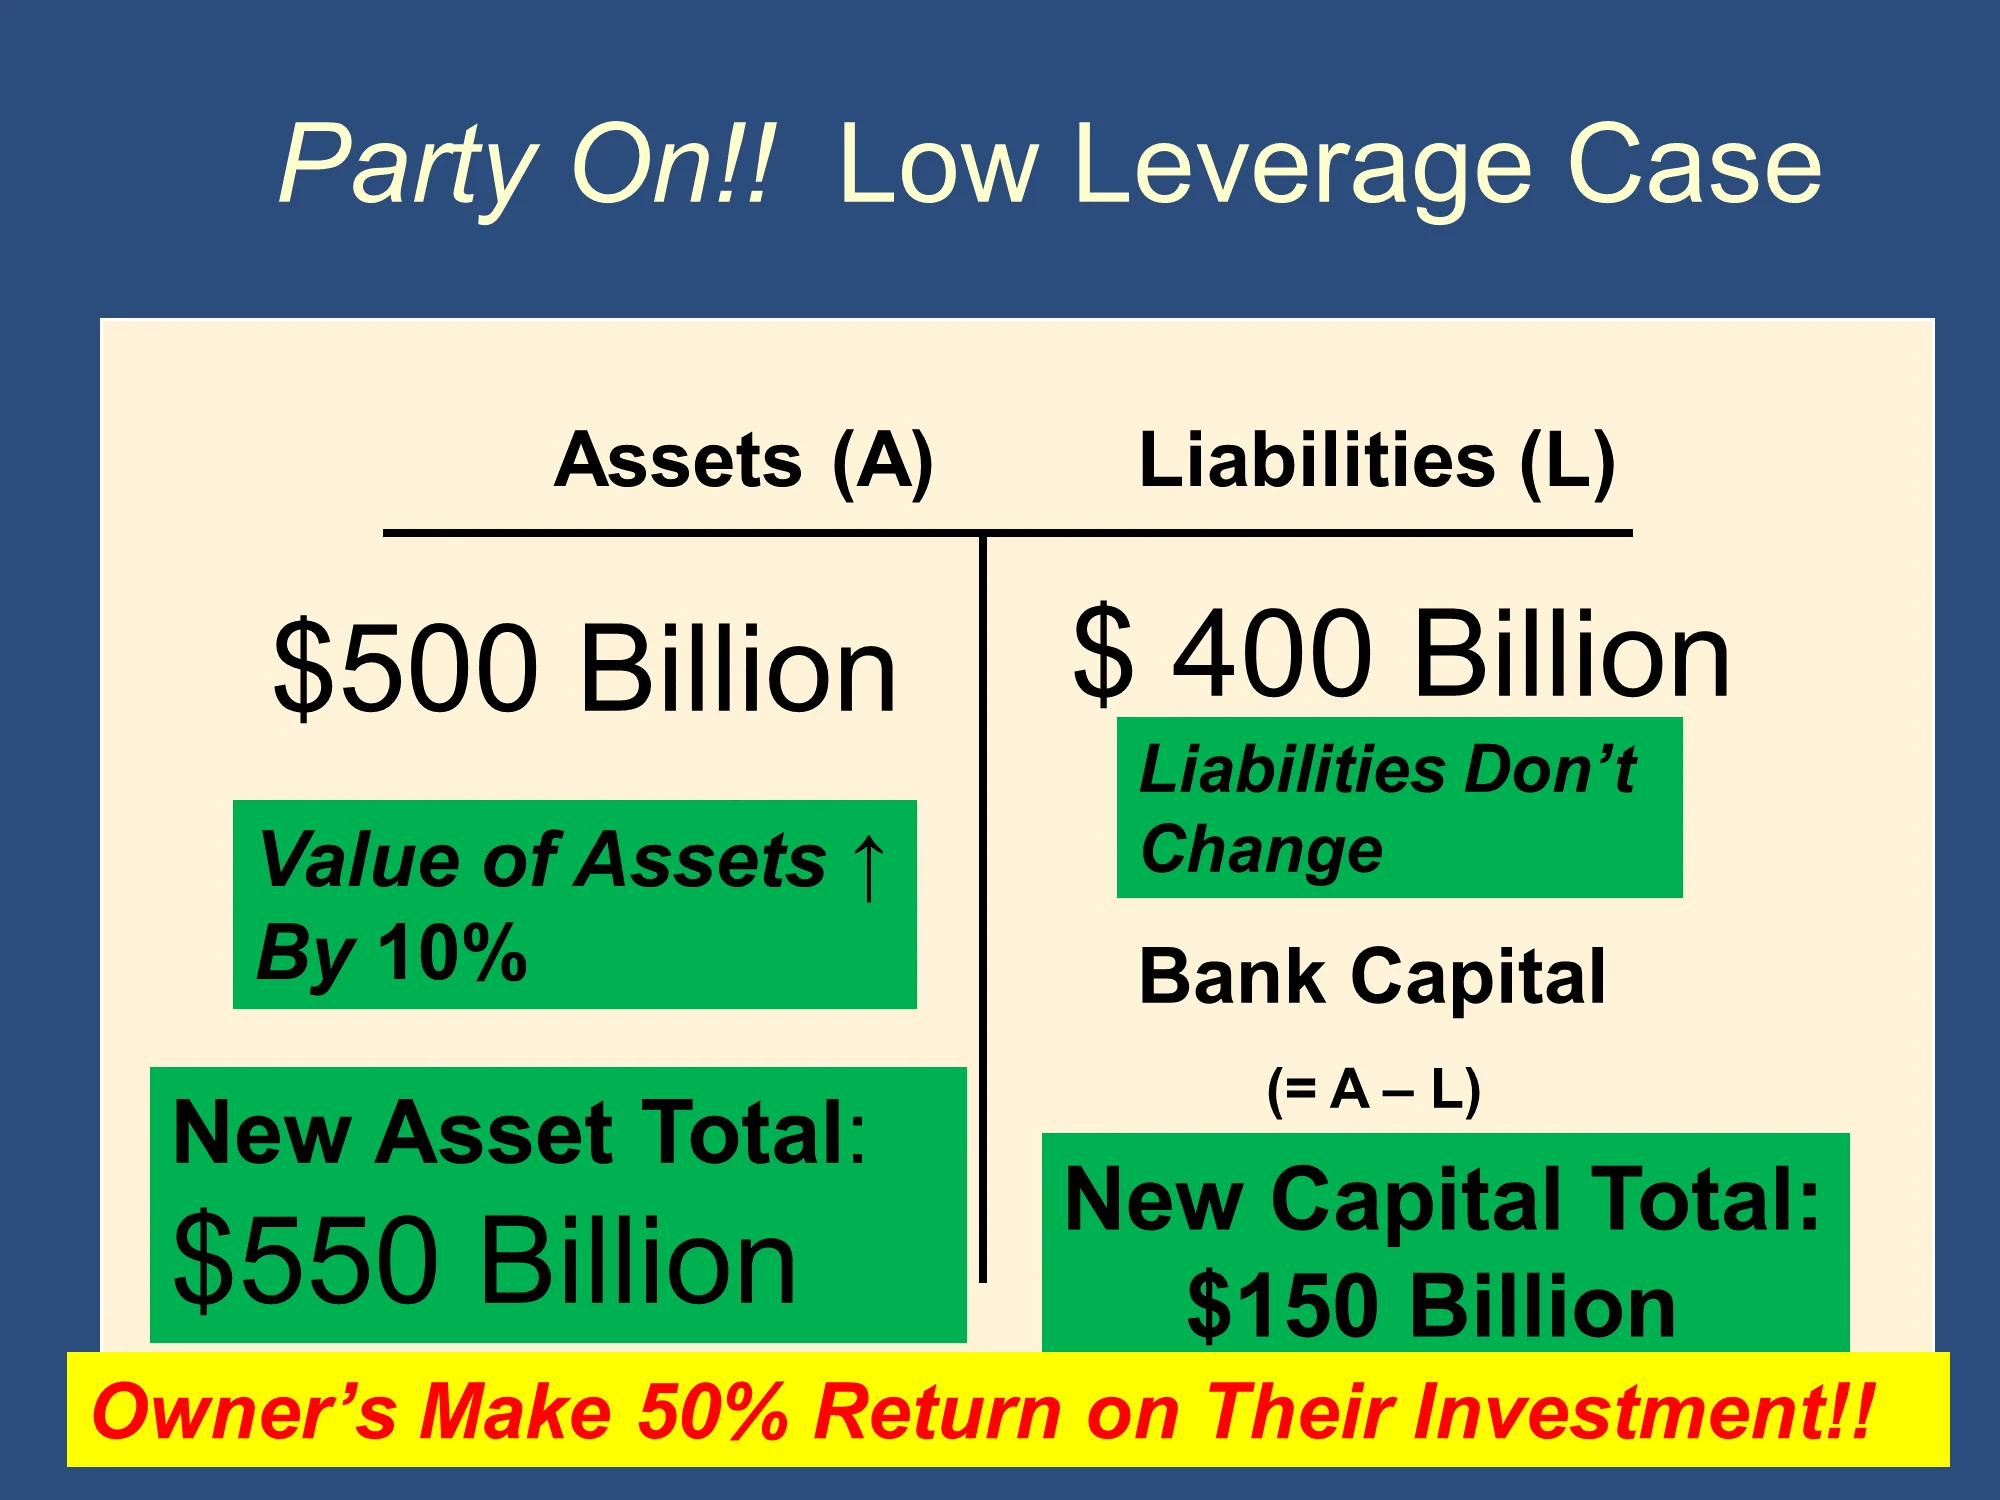
High Leverage Case (Party On!!)
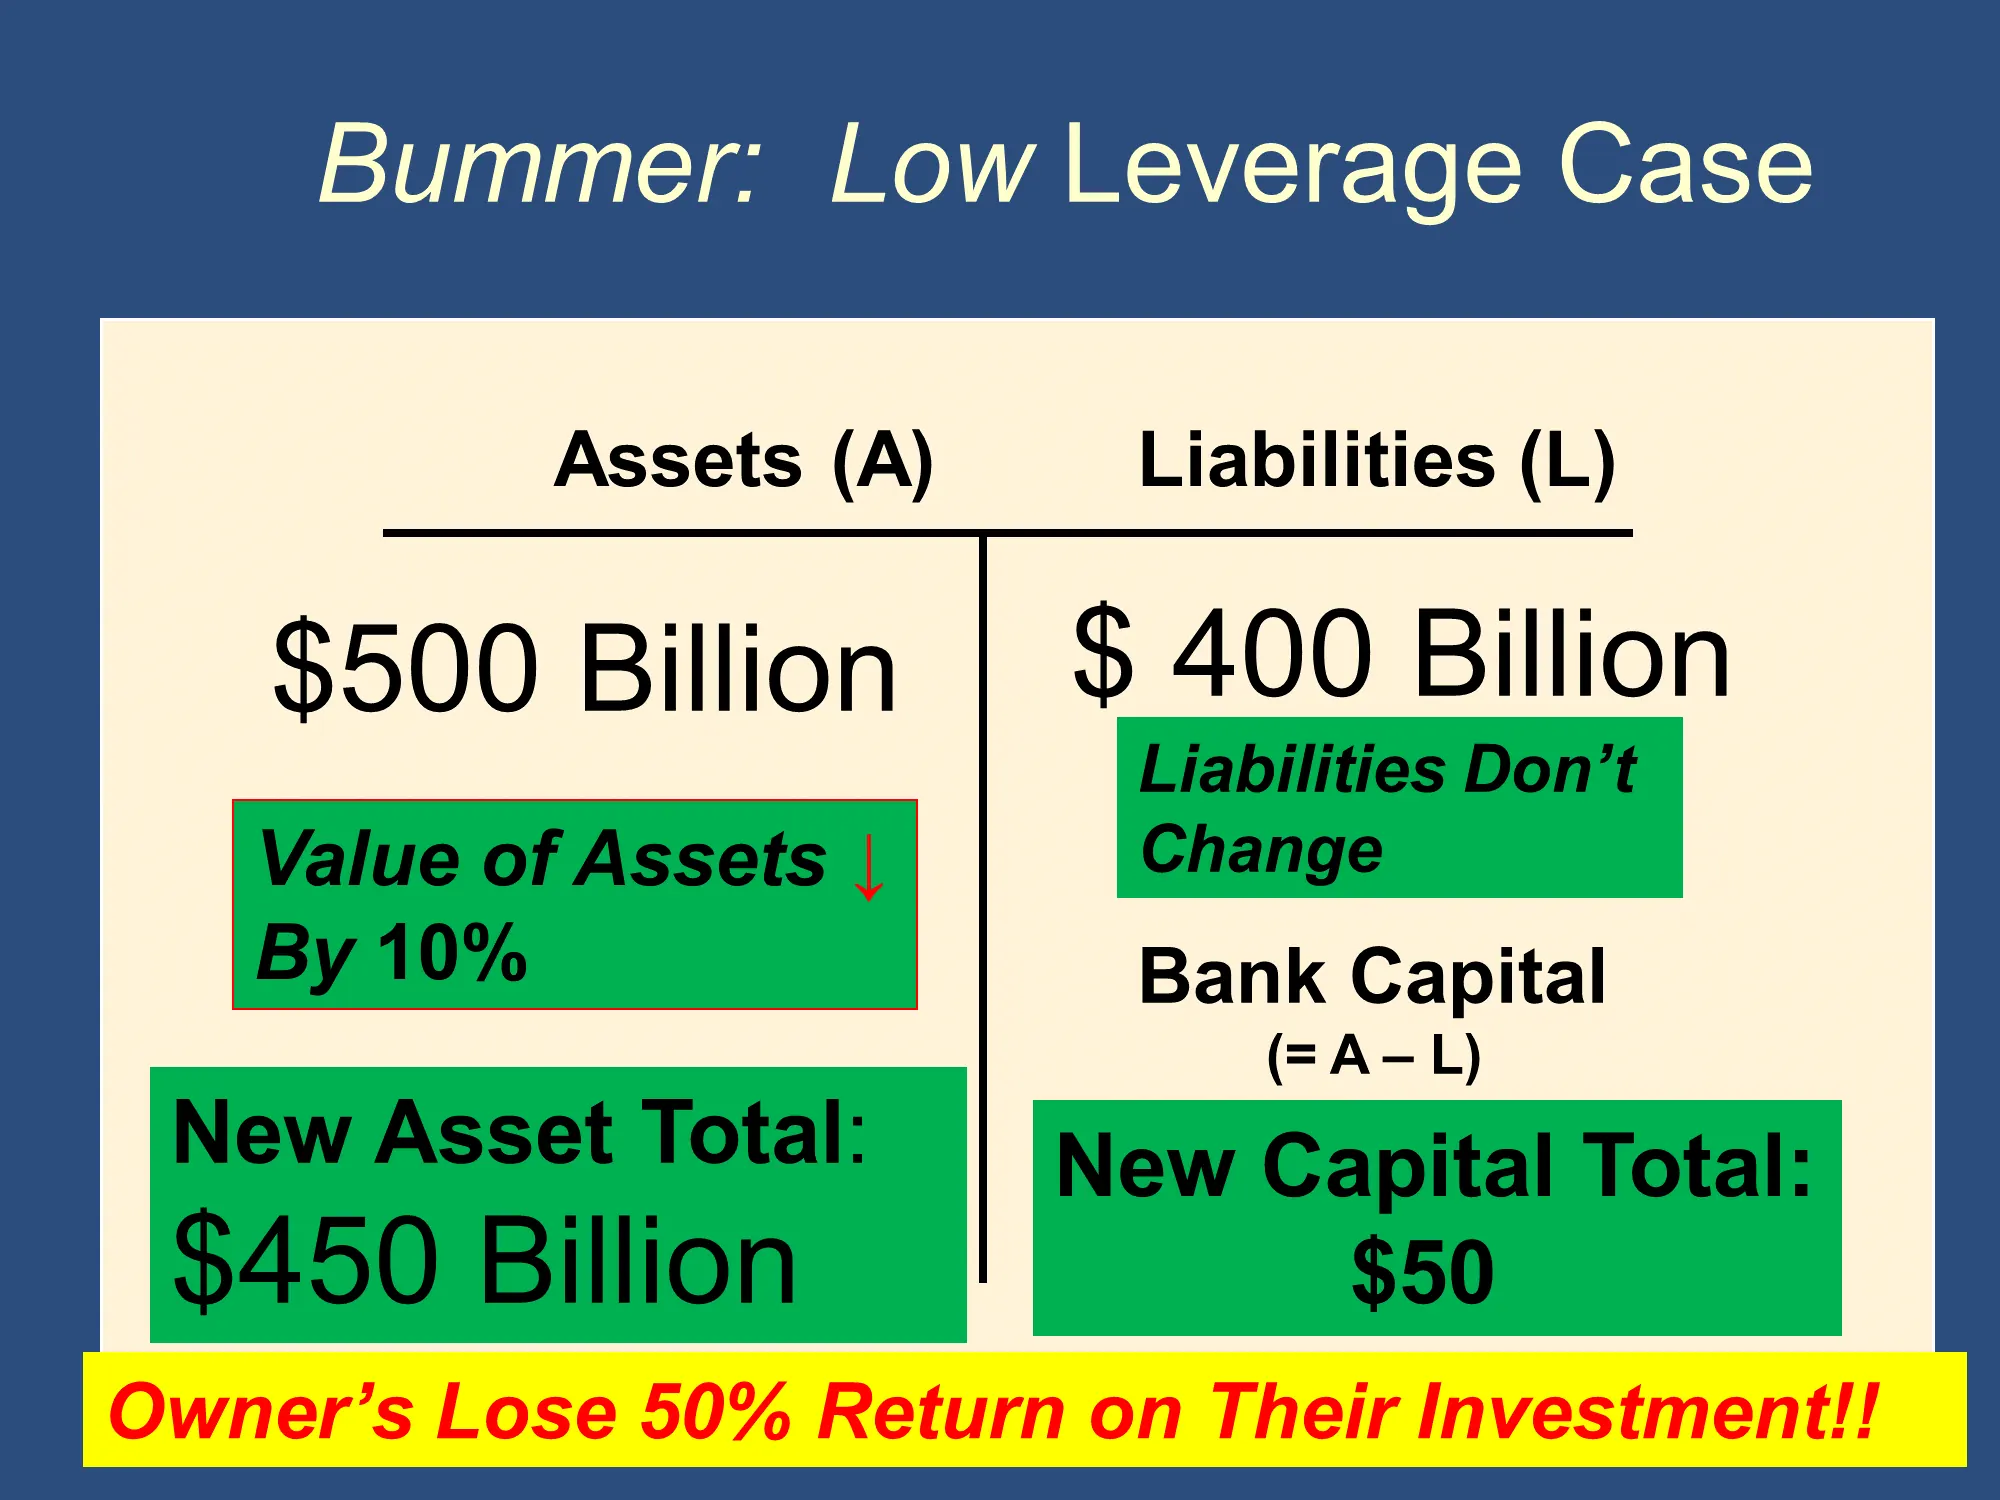
Low Leverage Case (Party On!!)
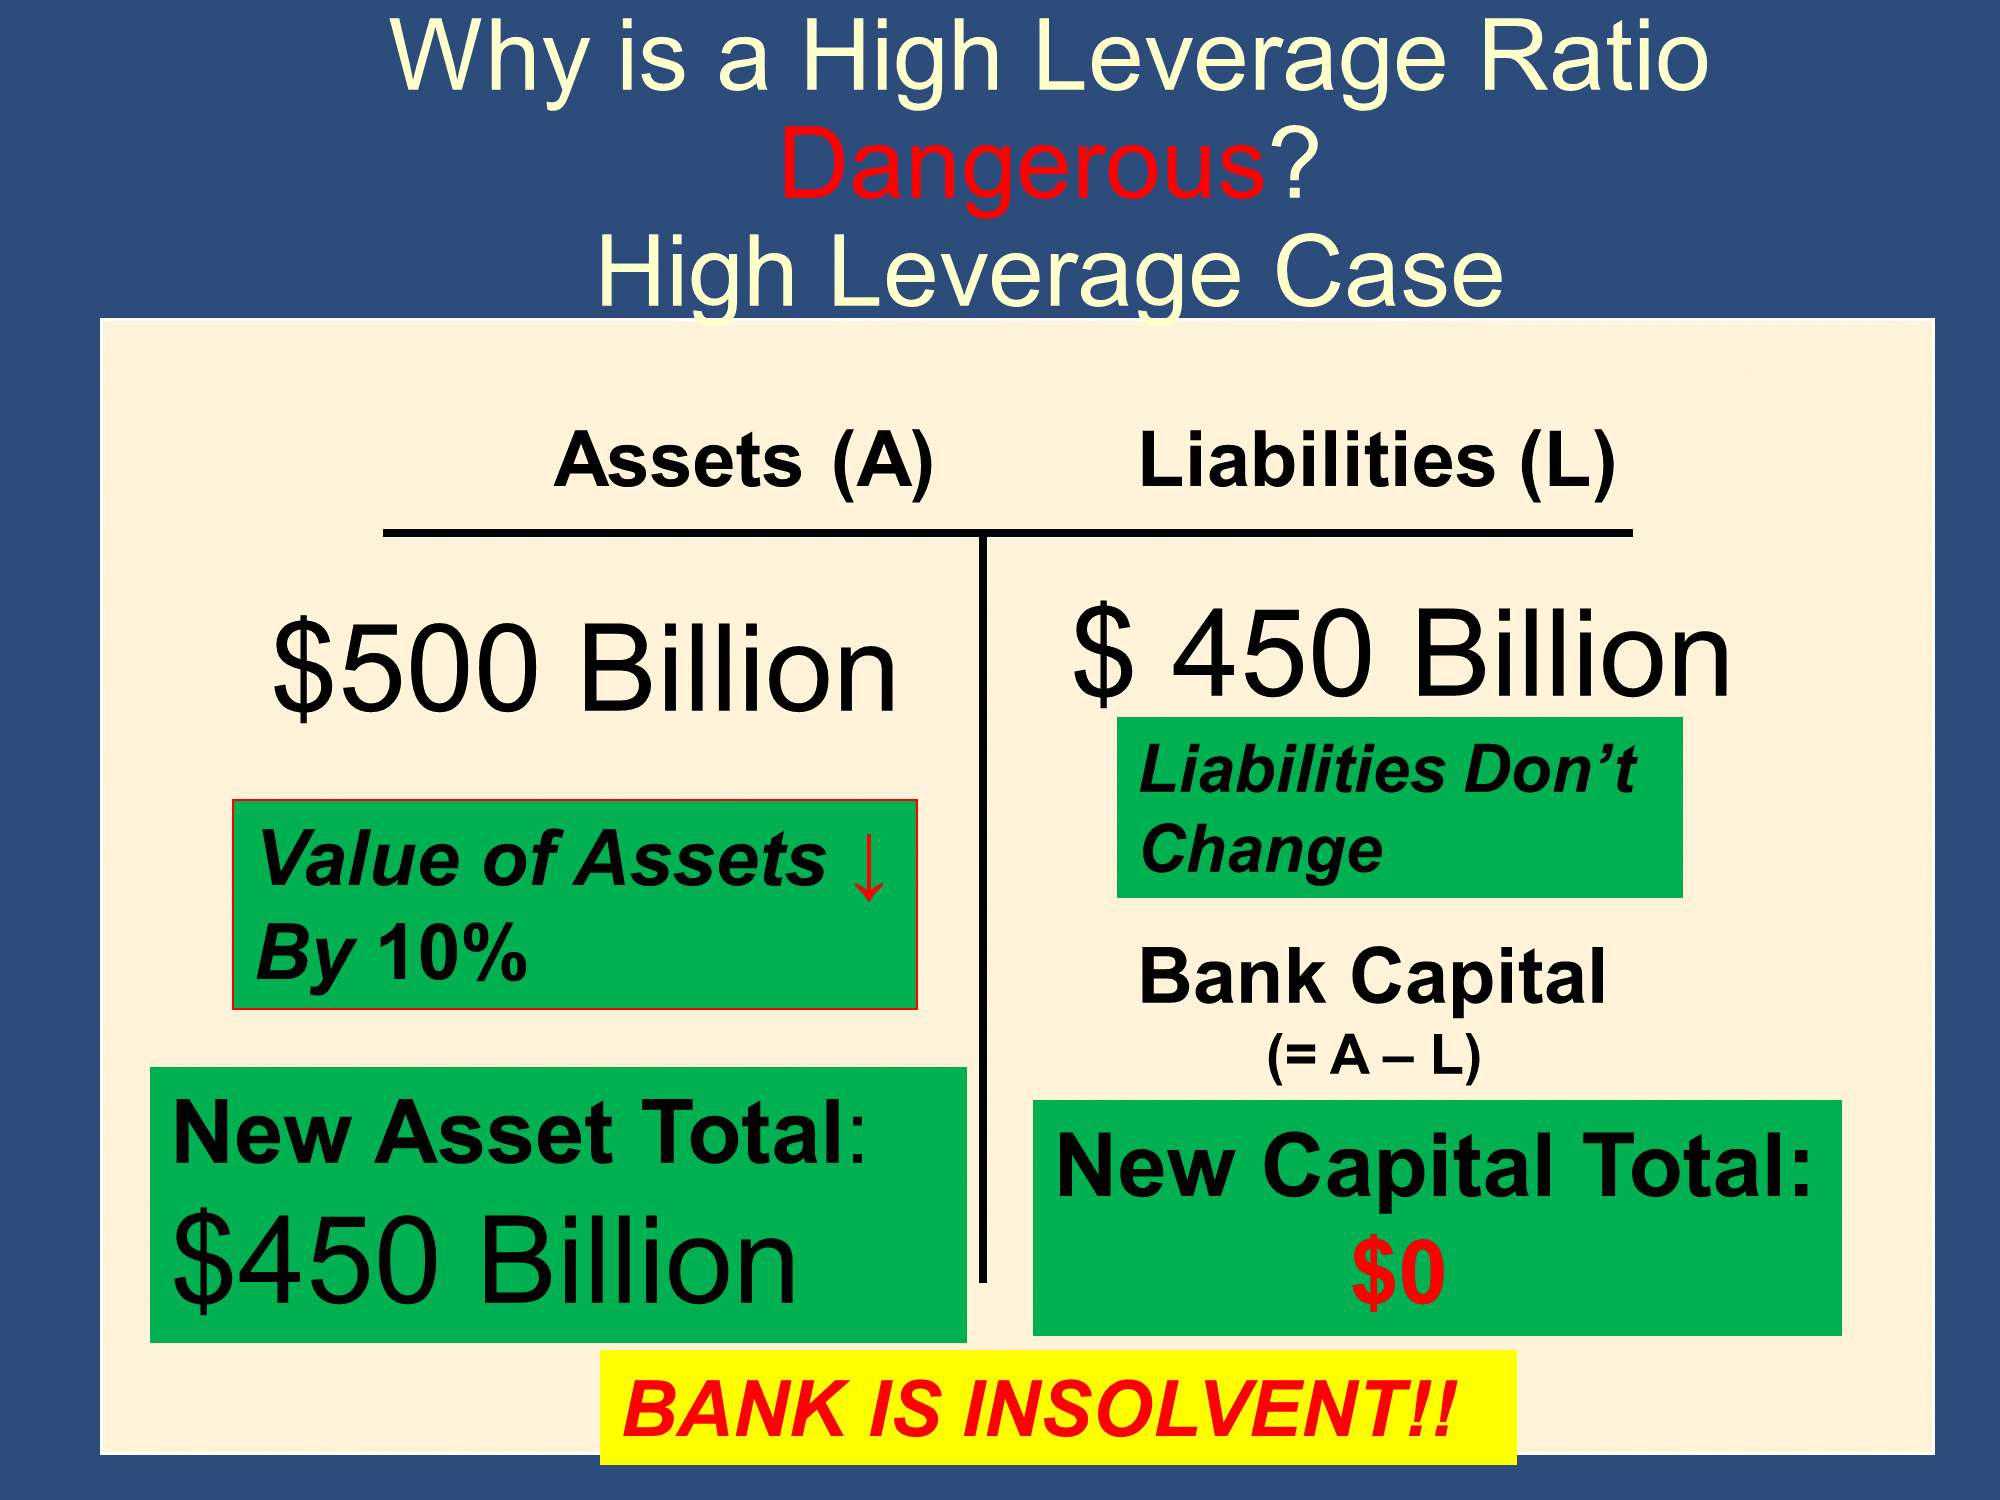
Why is High Leverage Dangerous?
High Leverage Case: BANK IS INSOLVENT!!
With a Leverage ratio of 10, if your assets lose 10% of their value, then your bank capital drops from $50B to $0. Your return on investment was -100%
Low Leverage Case: Owners only lose 50%
With a Leverage ratio of 5, if your assets lose 10% of their value, then your bank capital drops from $100B to $50B. Your return on investment was -50%
Levels of Debt and Leverage (continued)
- One of the explanations for the relatively high degree of leverage in banking is the existence of government guarantees like deposit insurance.
- These government guarantees allow banks to capture the benefits of risk taking without subjecting depositors to potential losses.
The Balance Sheet HAS TO Balance
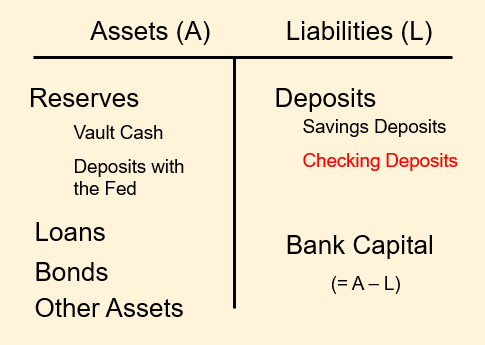
Bank Capital is defined as the difference between the dollar value of assets and the dollar value of liabilities:
If we do a little algebra we find that:
We really like this version of the formula because it means that if you add up all of the value of the assets of a bank (on the left-side) of the balance sheet and the Liabilities and Bank Capital (on the right-side), you get the same number. This can be very helpful in problem set questions, exam questions, and other contexts.
Money Multiplier
Introduction to the Money Multiplier Process
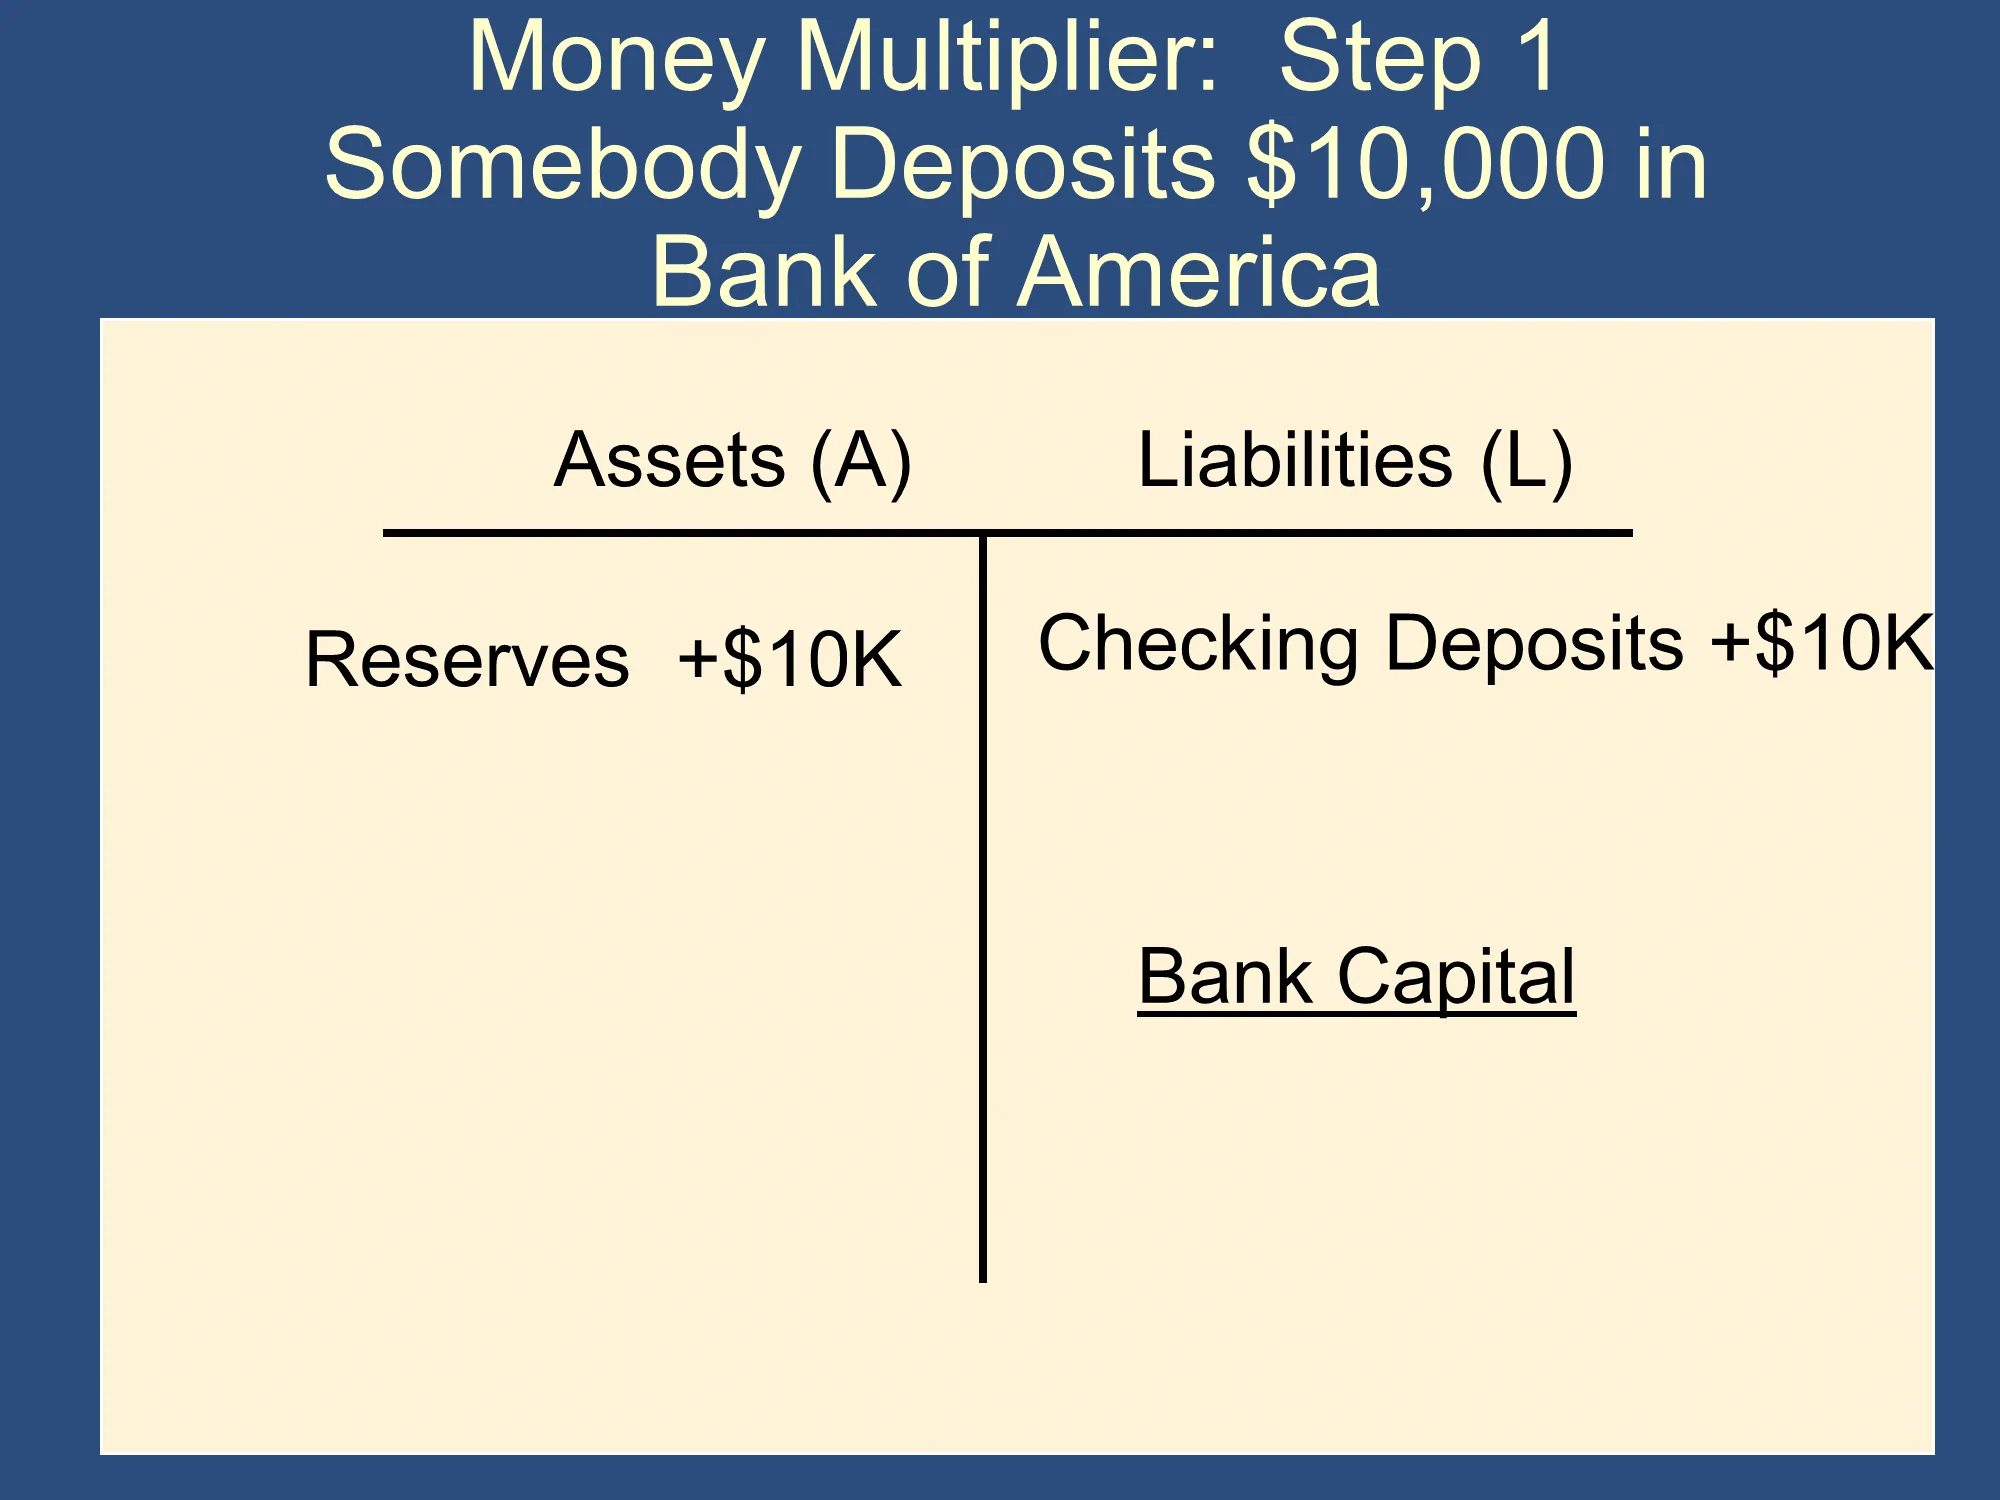
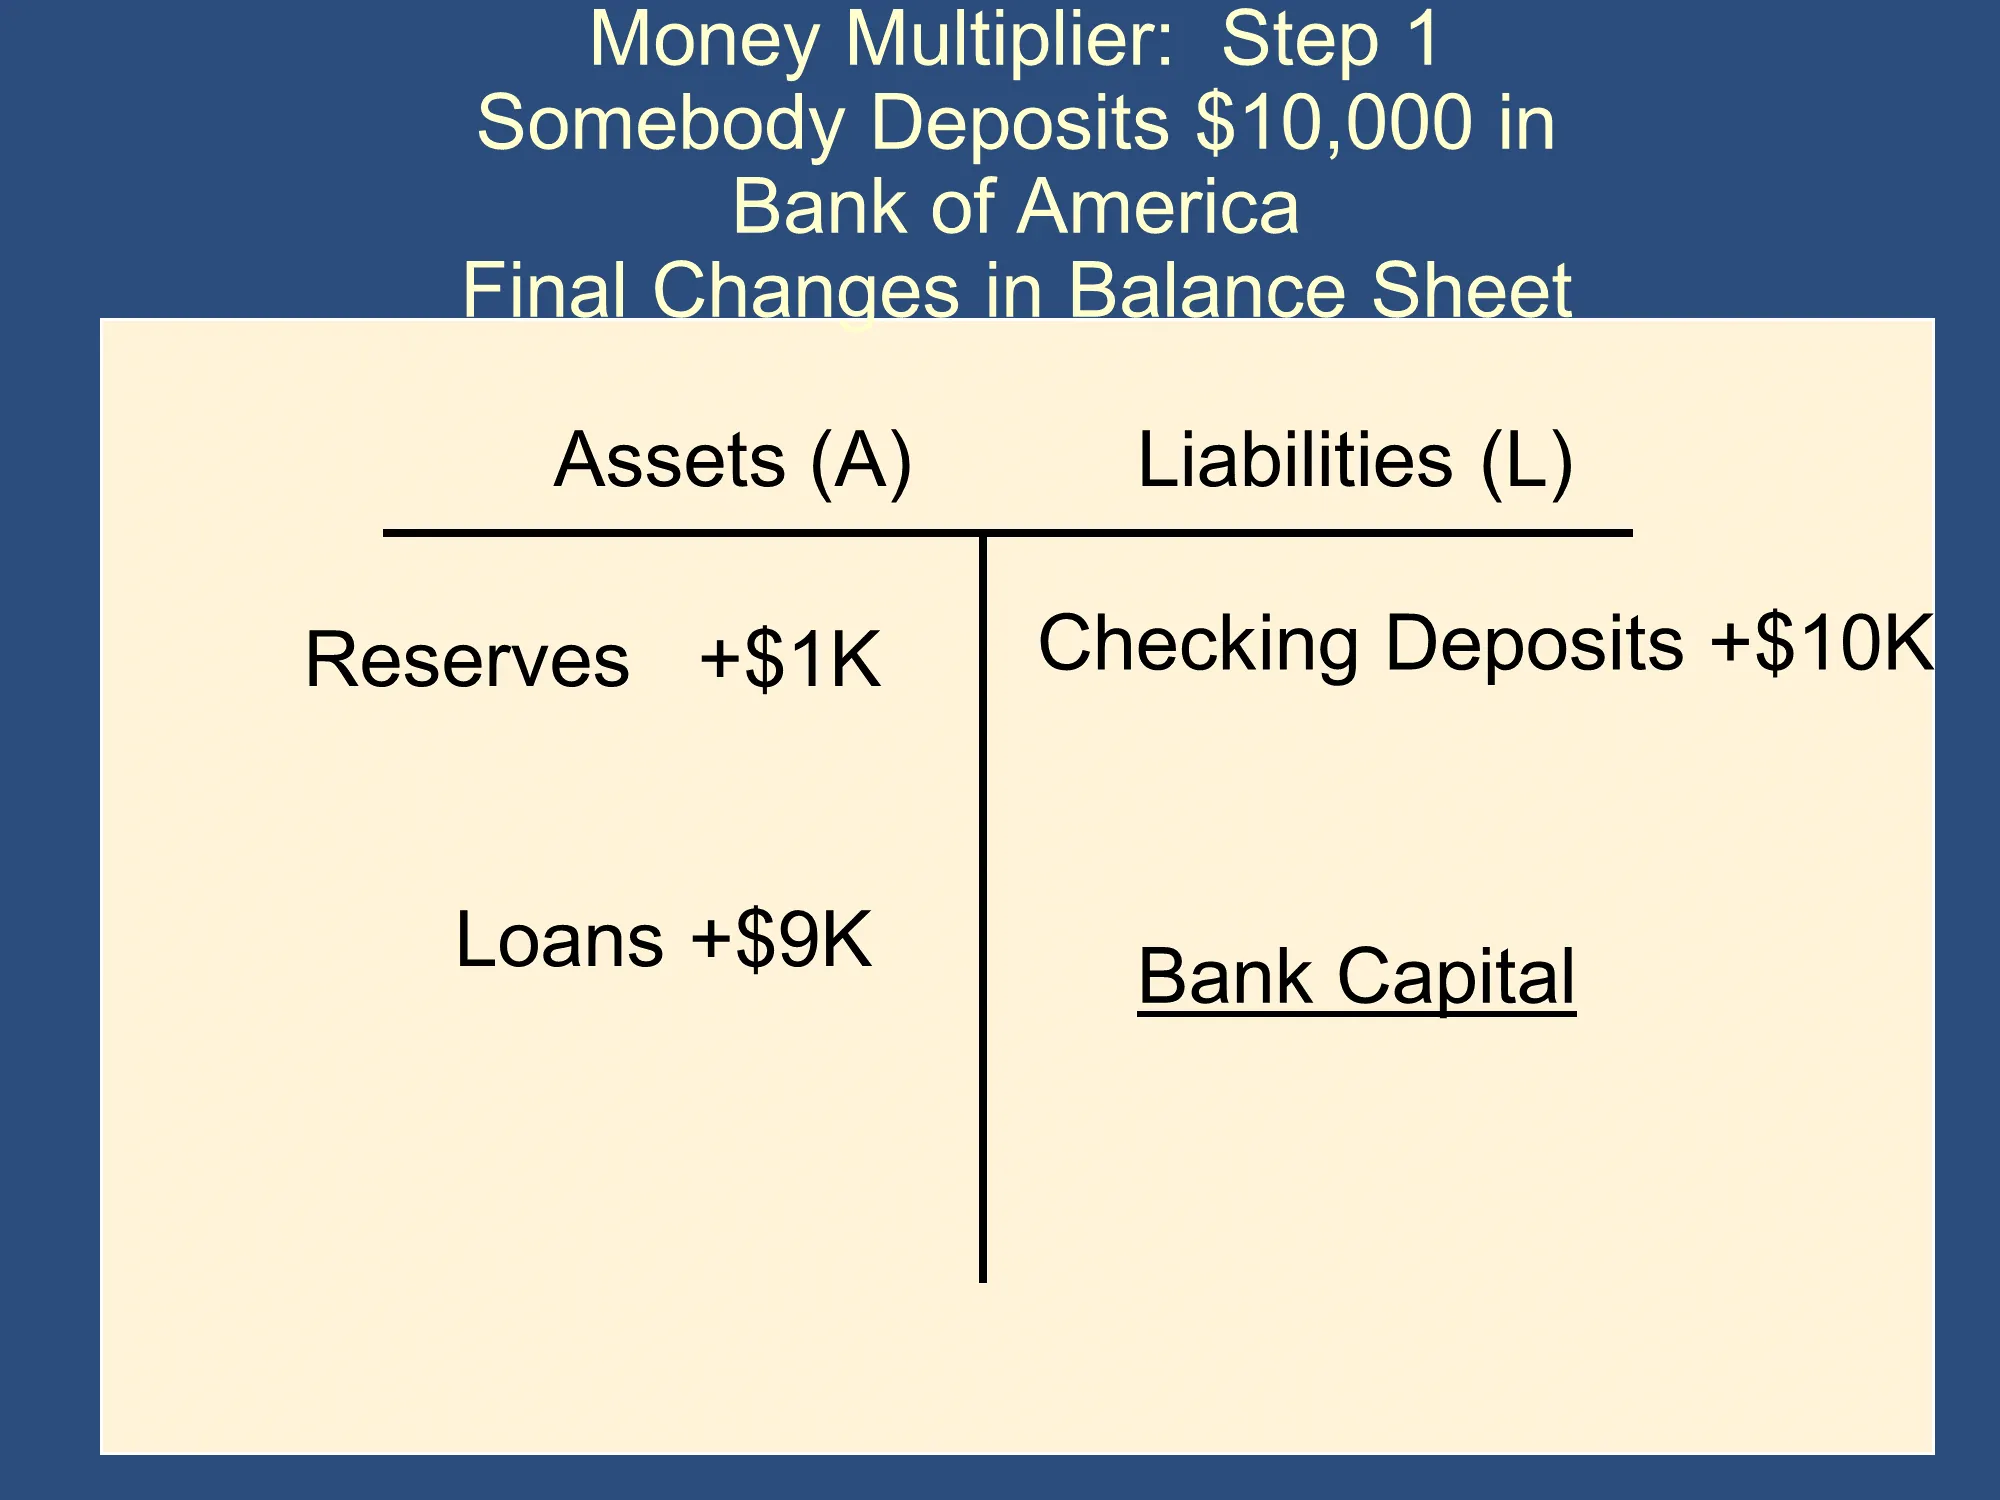
Money Multiplier: Step 1: Somebody Deposits $10,000 in Bank of America
Balance sheet after the deposit but before any additional loans are made:
(Total New Deposits = $10,000)
The Bank uses the new reserves from that deposit to an additional $9,000 loan:
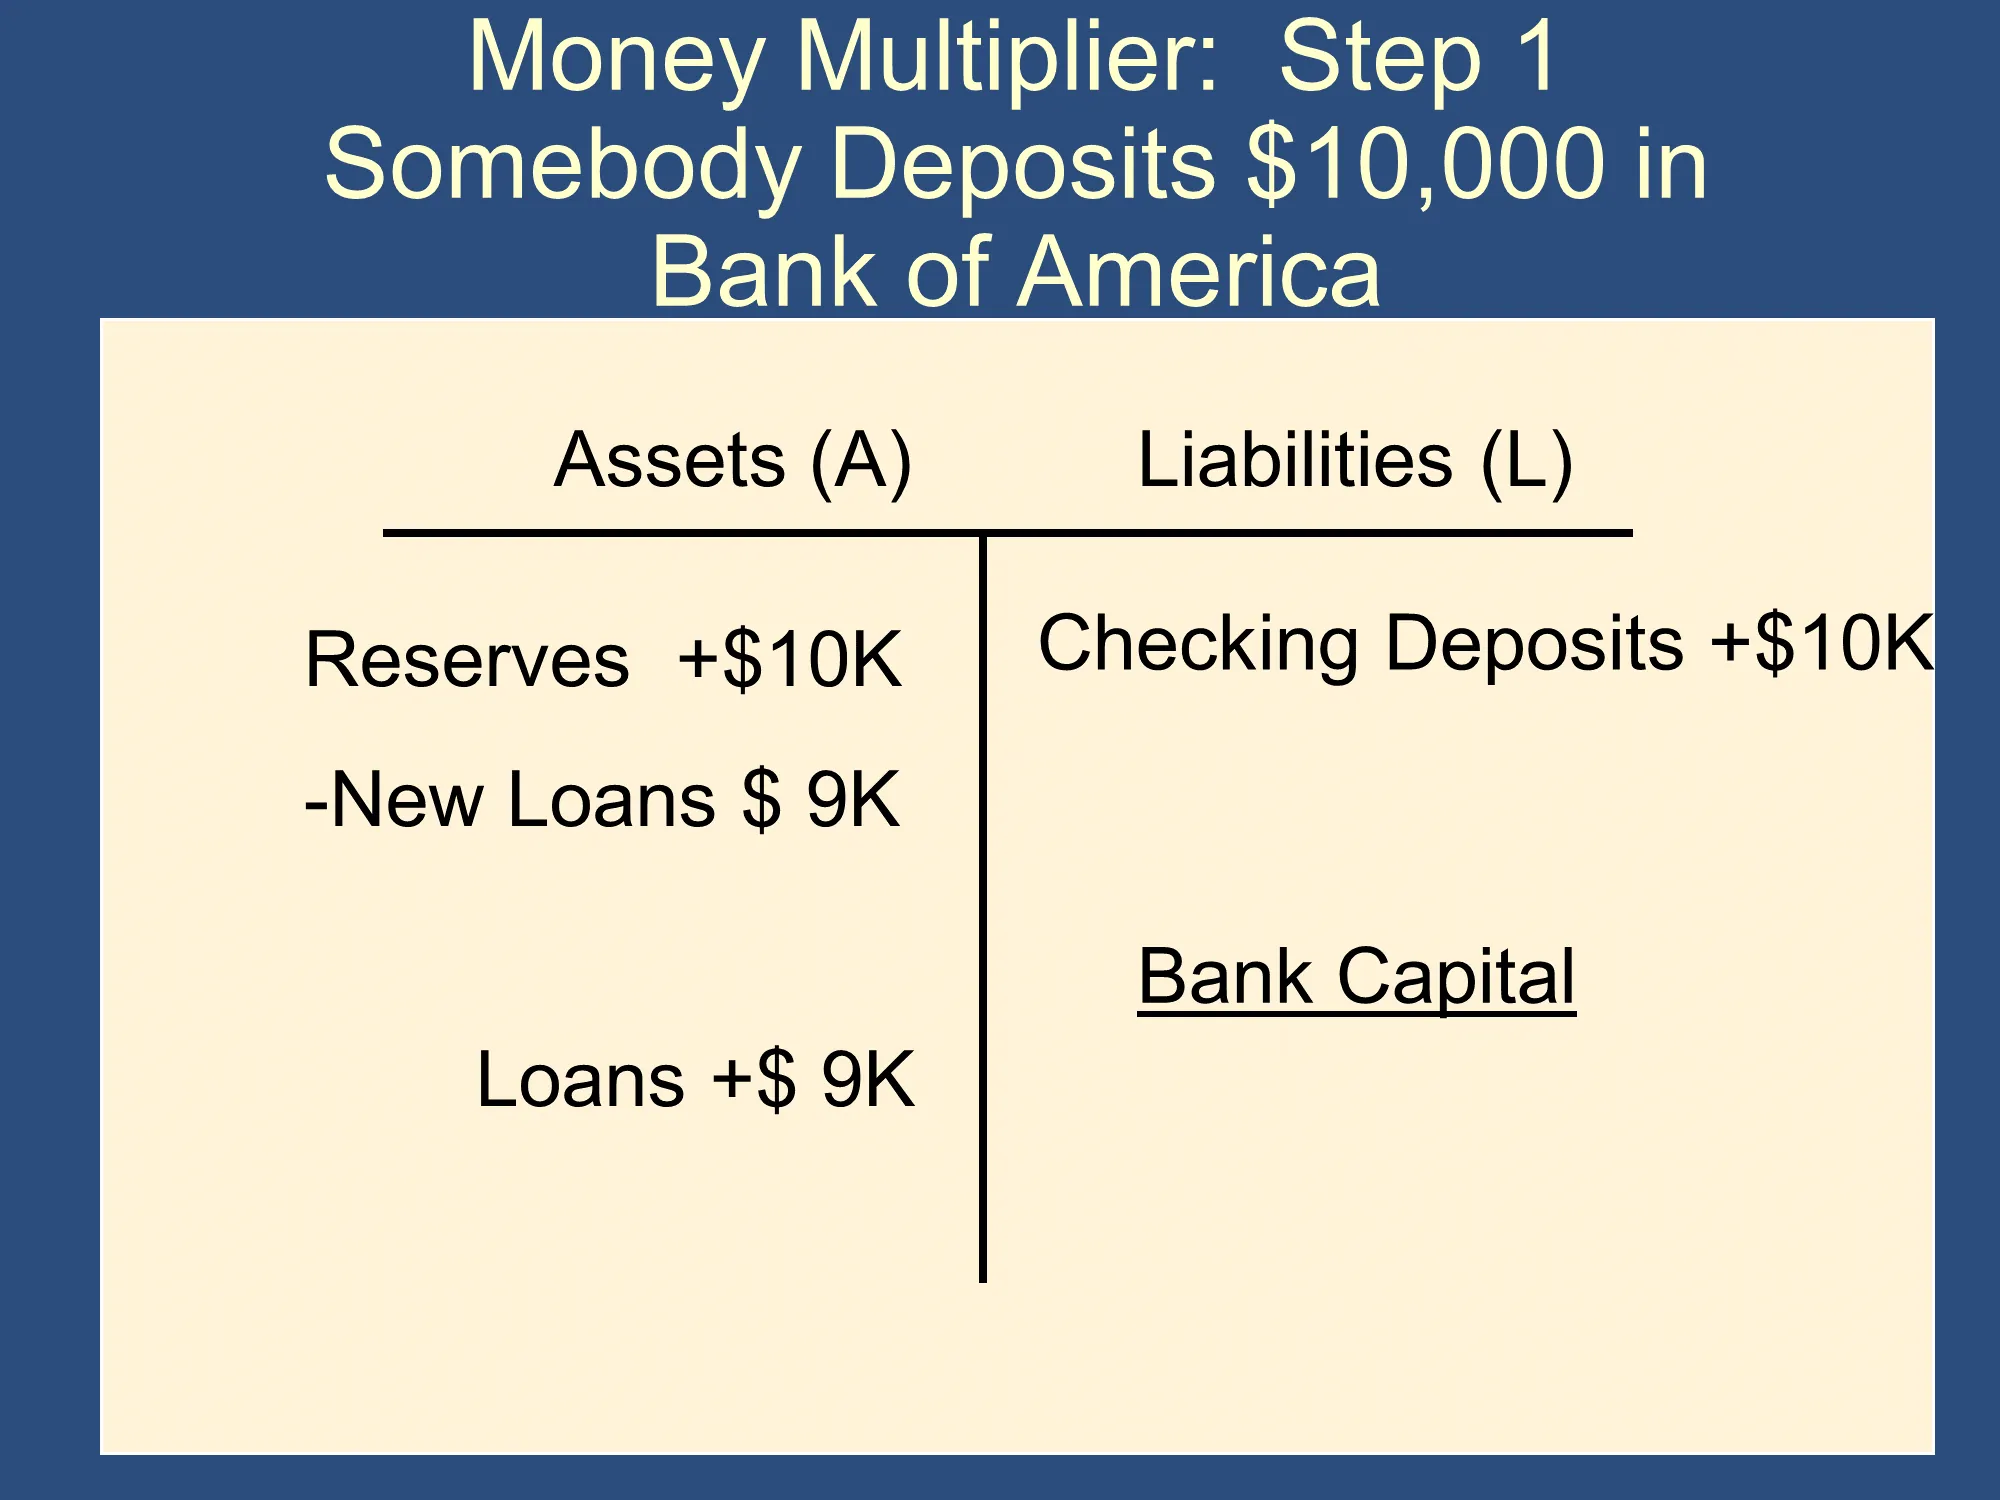
Bank of America’s Final Balance Sheet:
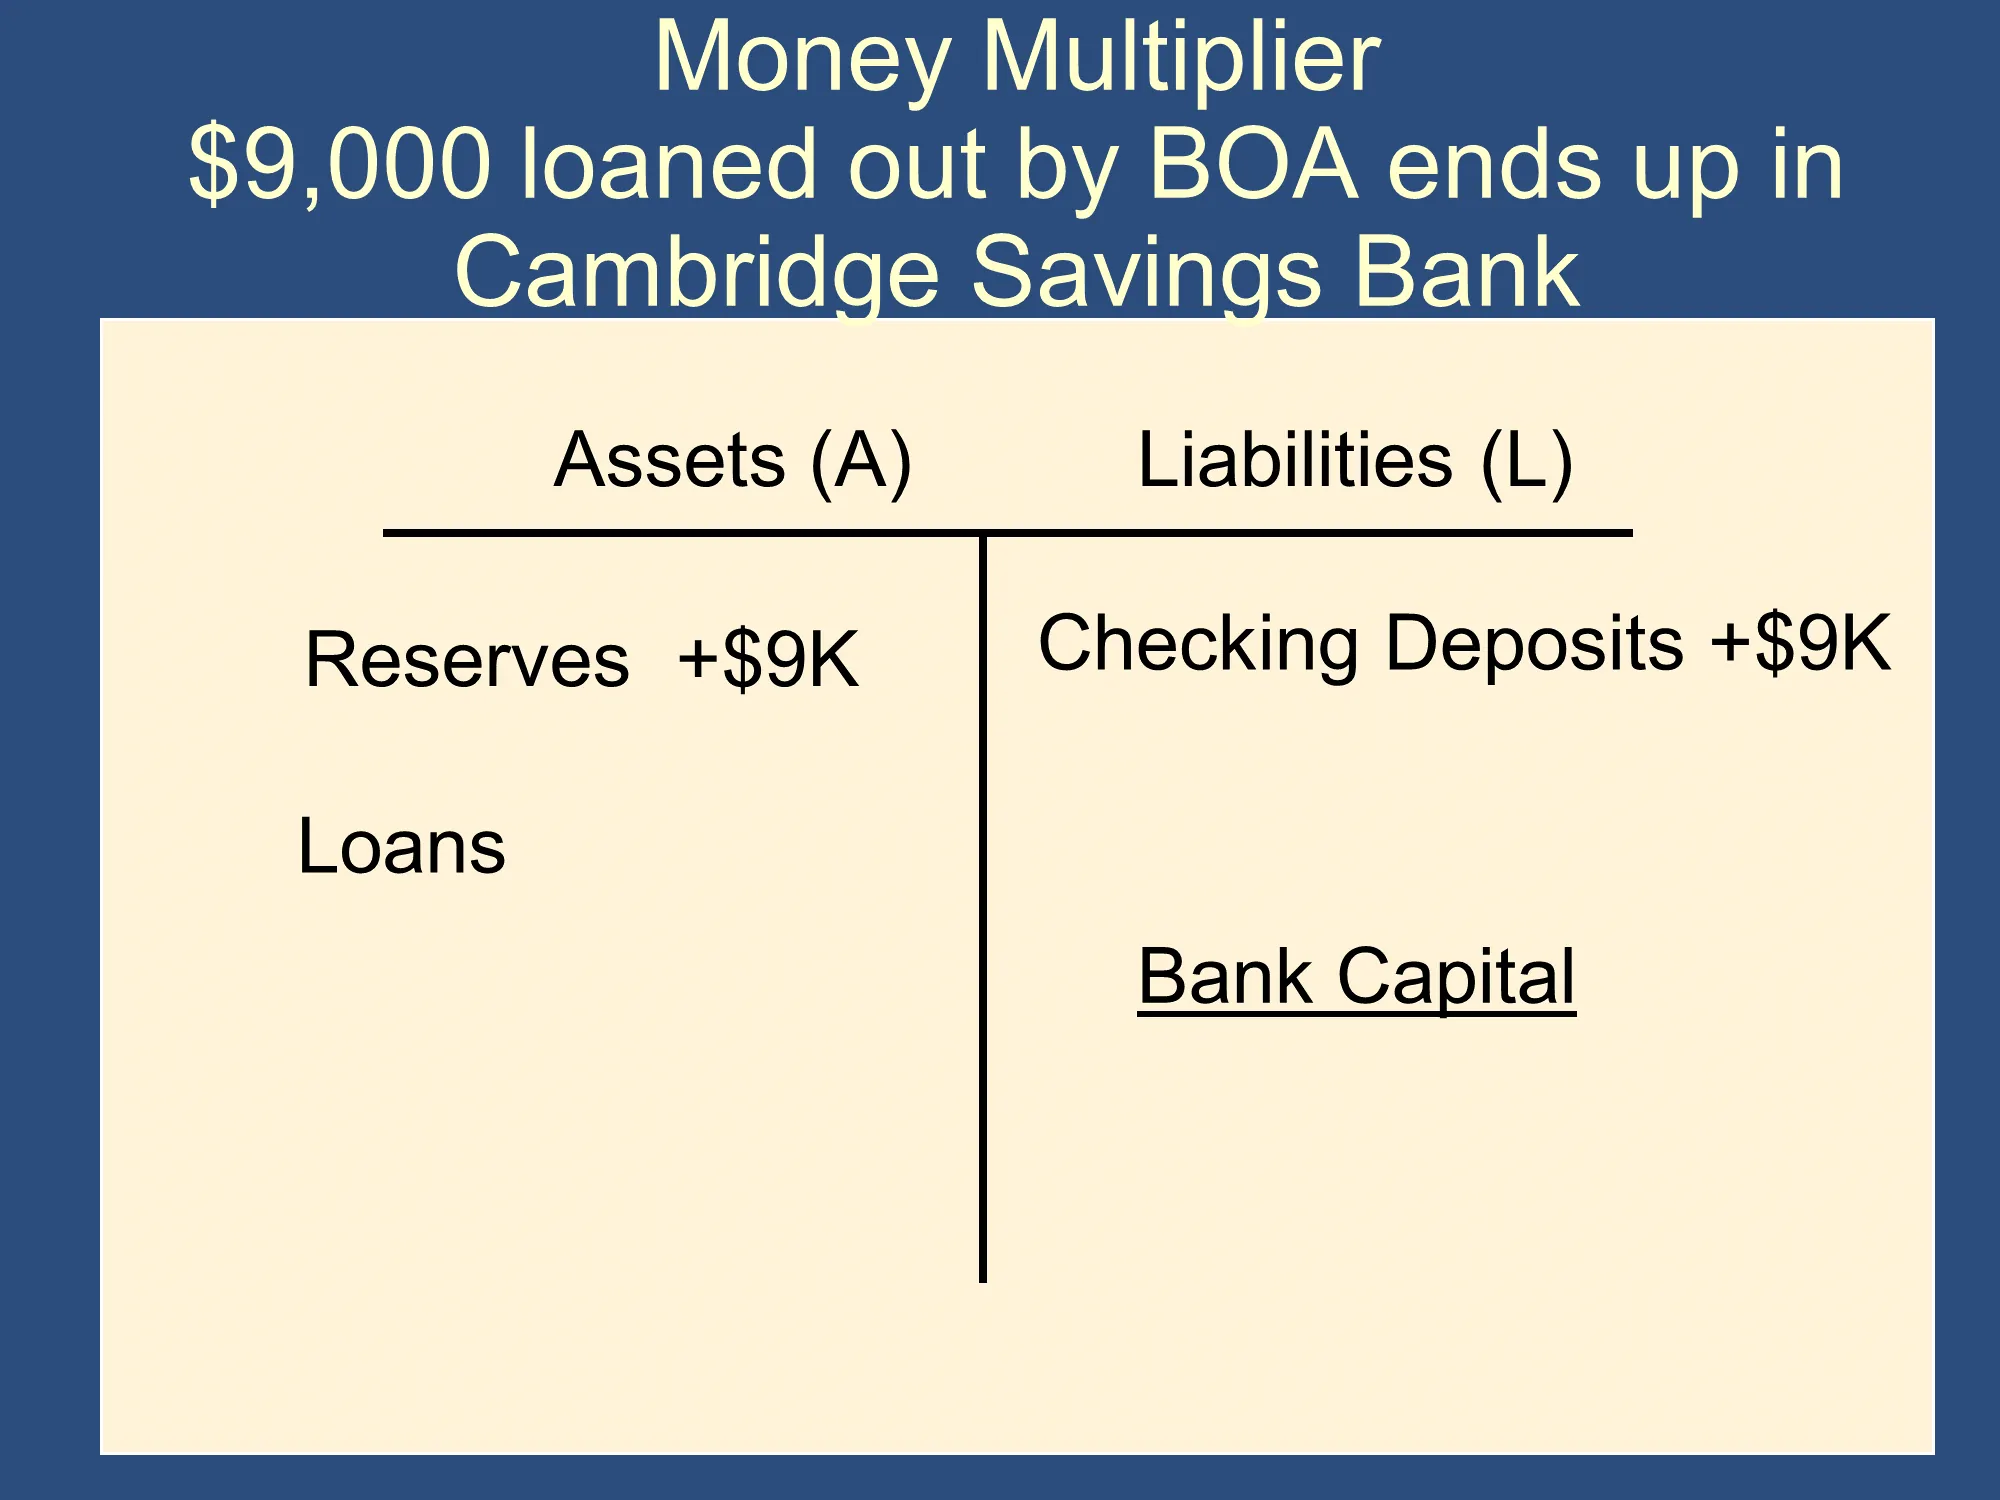
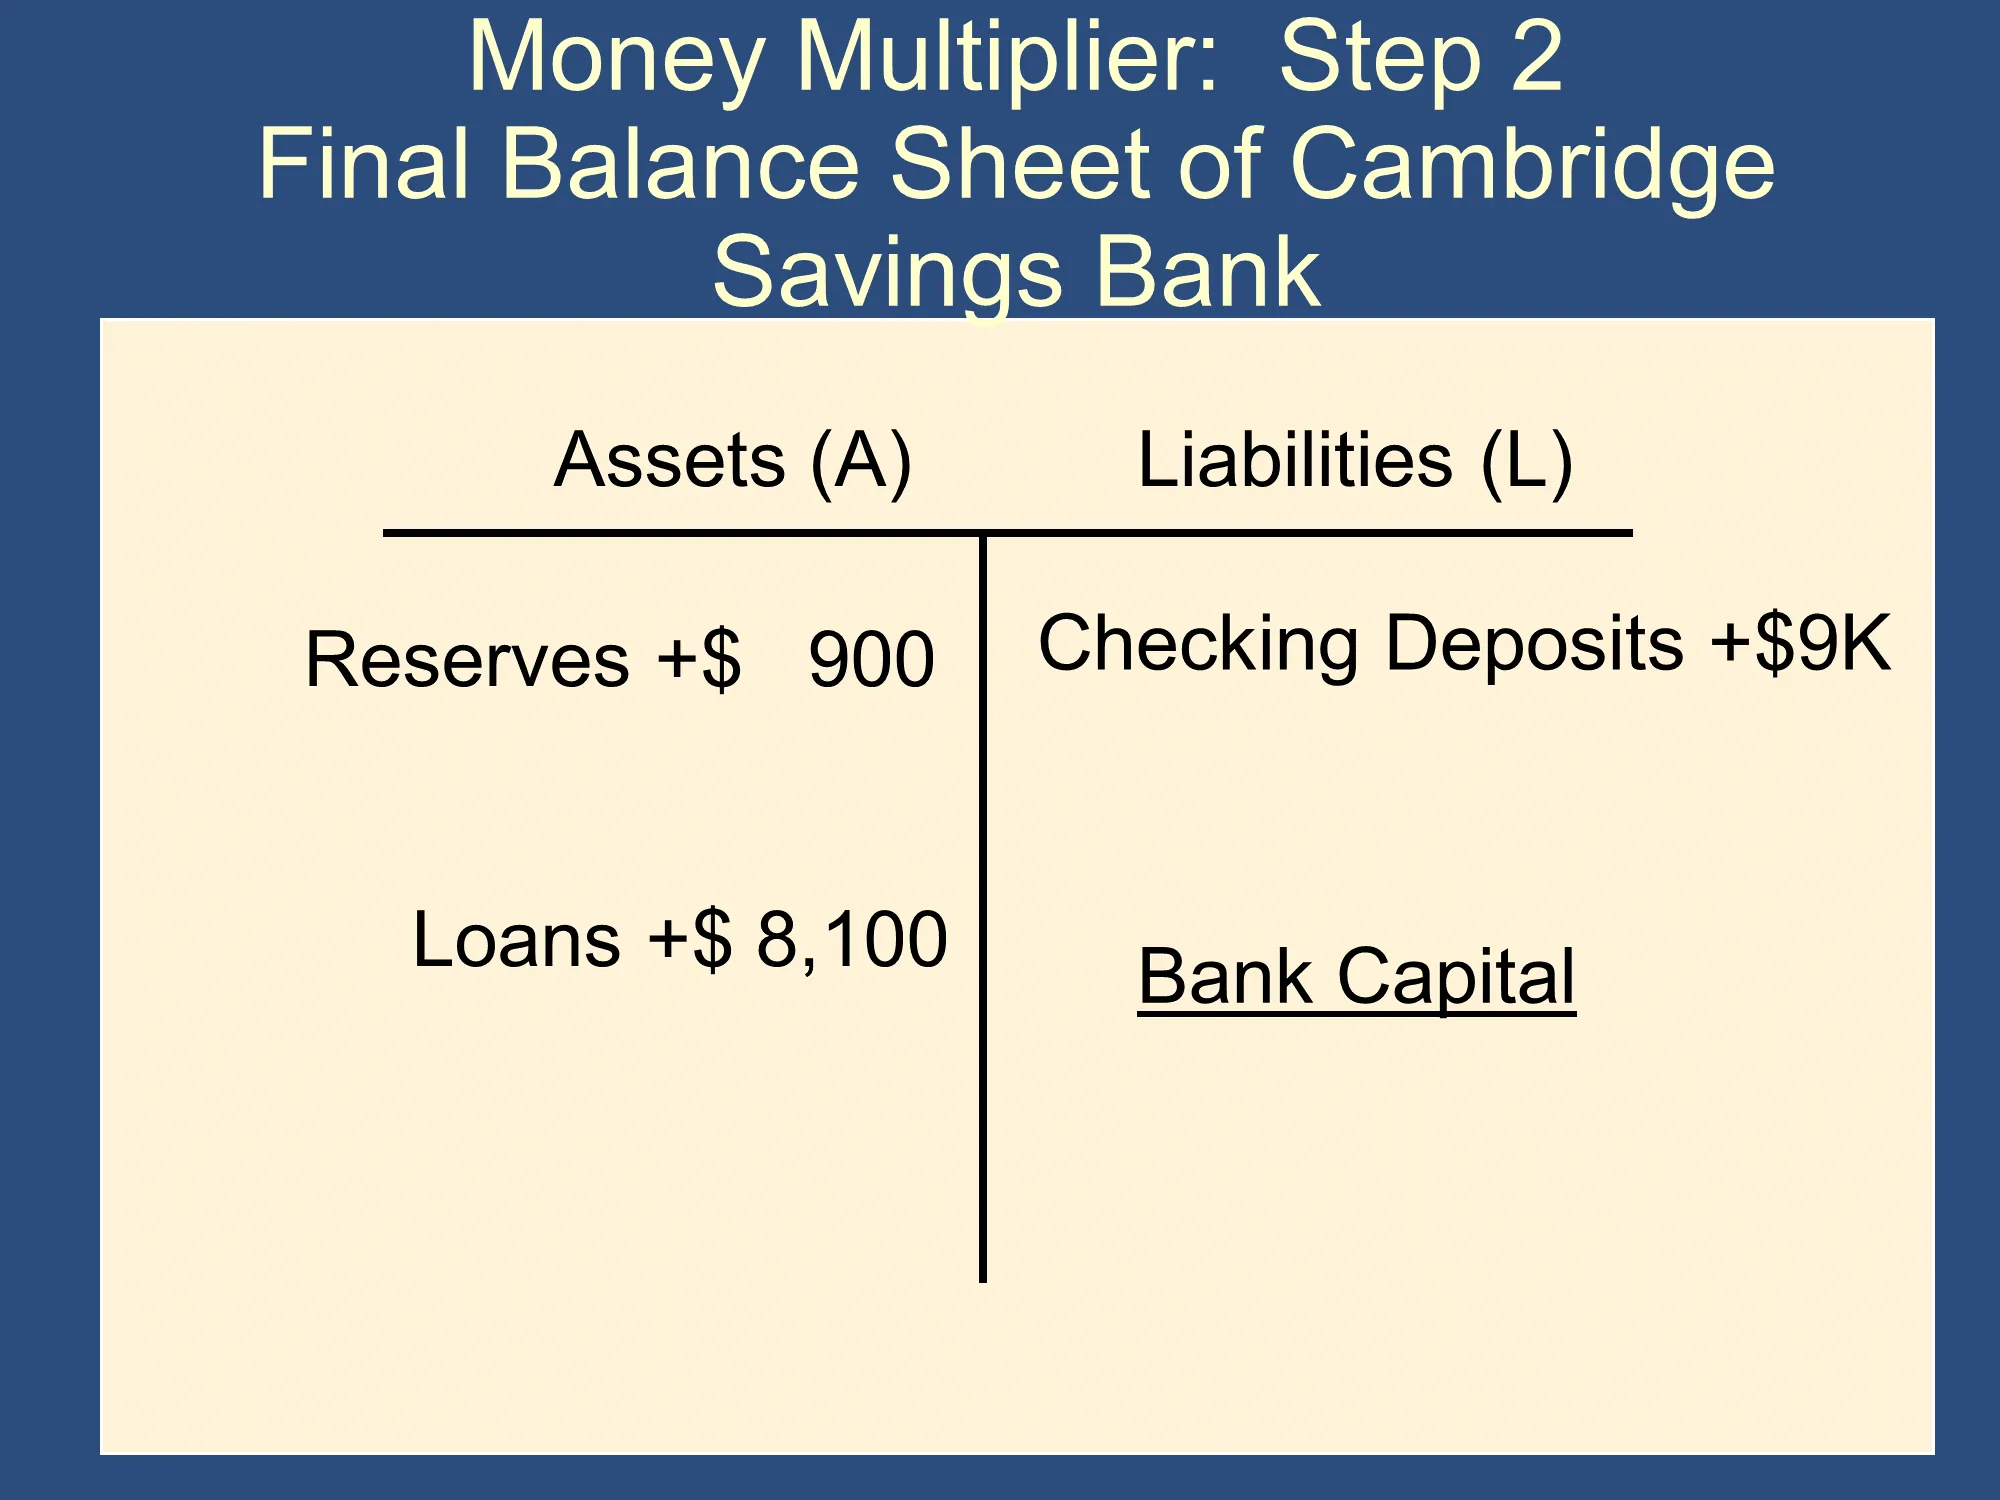
Money Multiplier: Step 2 - After the loan is spent, the $9,000 is deposited at another bank
At the end of step 1, an additional $9,000 loan was made. The money was spent and deposited in a second bank (Cambridge Savings Bank).
Final Balance Sheet of Cambridge Savings Bank:
Total New Deposits:
$10,000 Original Deposit in BOA
$9,000 Deposit in CSB
The second bank (CSB) makes additional loans
After the entire money multiplier process:
Total New Deposits
$10,000 Original Deposit in BOA
$9,000 Deposit in CSB
$8,100 Deposit in Sovereign Bank
$7,290 Deposit in Citibank
$6,561 Deposit in Capital One
… etc.
Money Multiplier Process
Deposit → Loan
→ Deposit → Loan
→ Deposit → Loan
→ … etc.
Total Change in Deposits
Total Change in the Money Supply
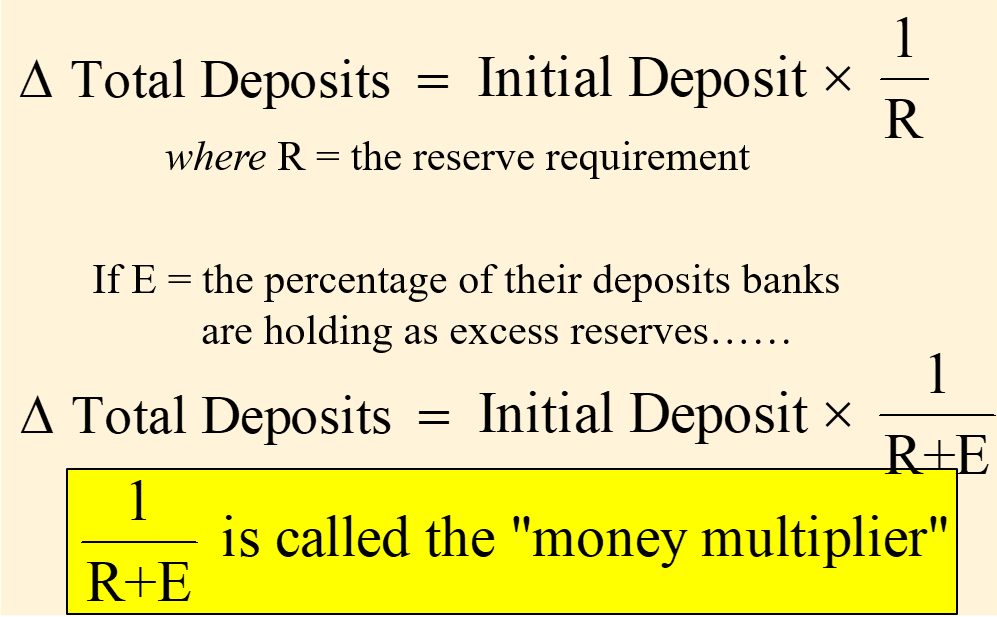
Two Fundamental Equations of Money Creation
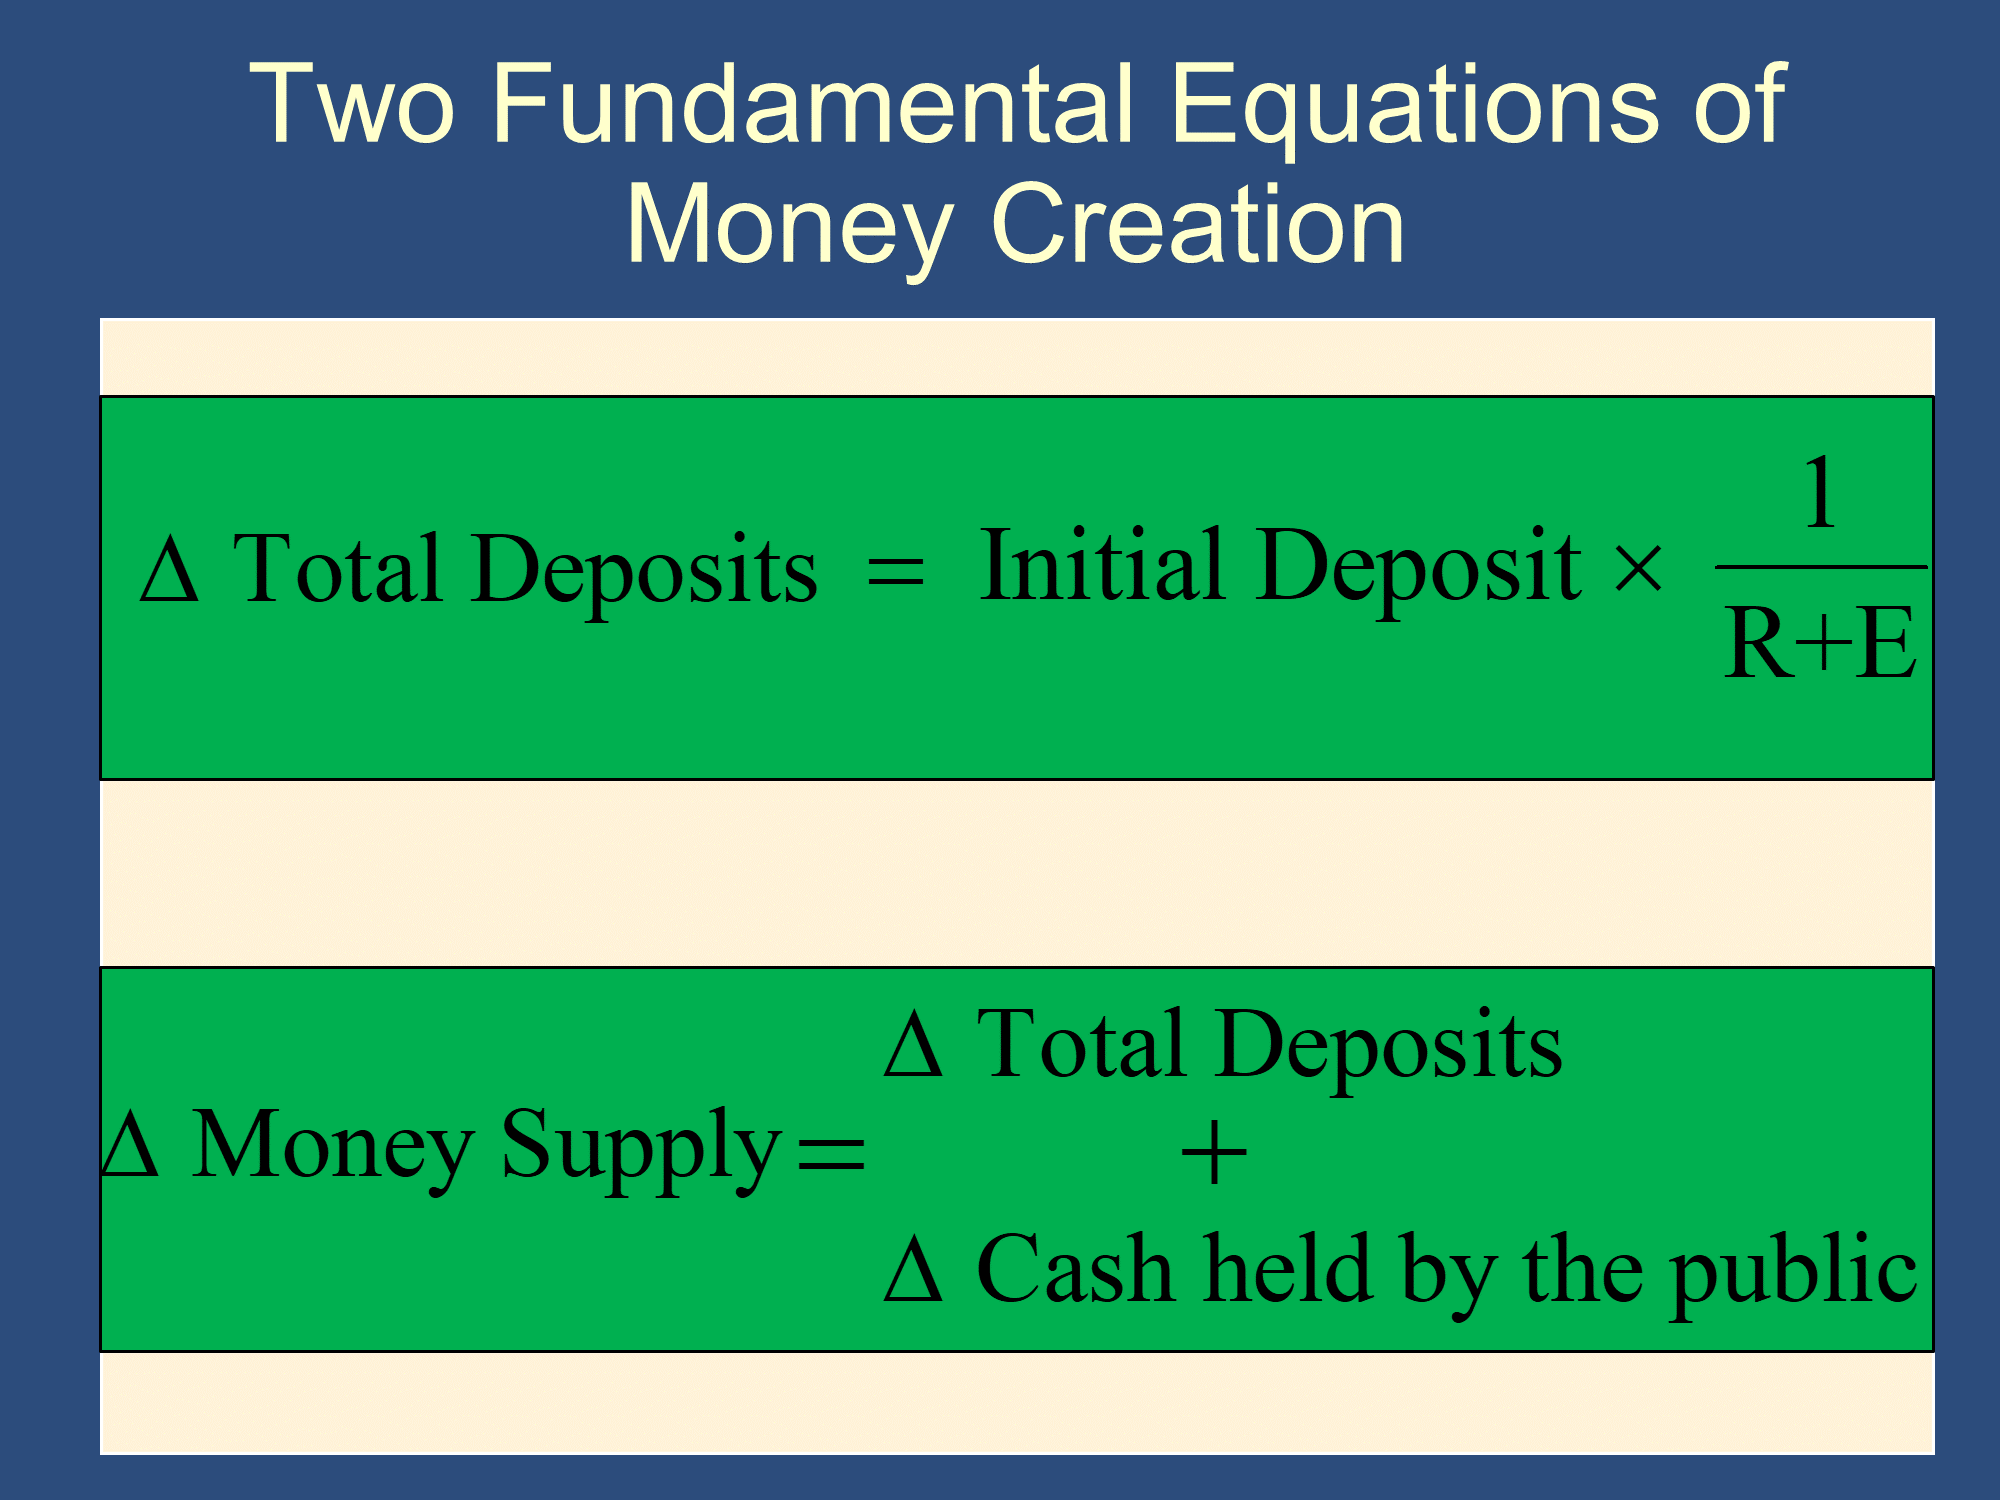
Example: Total Change in Deposits and Money Supply
$10,000 Deposit
R = 10%
E = 0%
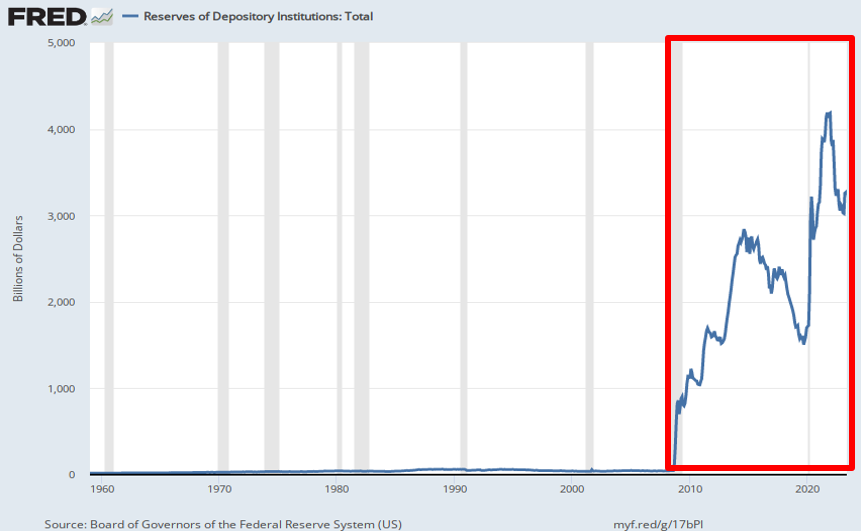
Excess Reserves Since the Financial Crisis
Total Change in Deposits and Money Supply
What if E=10%?
R still =10%
R = 10%
E = 0%
Reverse Money Multiplier Process
What happens if somebody withdraws $10,000 from the bank?
Sets in motion the reverse money multiplier process.
Someone Withdraws $10,000 from Bank of America
| Assets(A) | Liabilities(L) |
|---|---|
| Reserves - $10,000 (Actual Reservers ↓ by $10,000) Bank is $9,000 short of reserves | Deposits - $10,000 Required Reserves ↓ by $1,000 Bank Capital (=A-L) |
Reverse Money Multiplier Process
Four options when a bank is short of reserves:
- Borrow the needed reserves from another bank on the Fed Funds” market
- Borrow the needed reserves from the Fed at the “discount window”
- Reduce loans
- Sell securities (bonds)
Eventually, some bank will need to do (3) of (4)
Bank of America
| Assets(A) | Liabilities(L) |
|---|---|
| Reserves +$9,000 Loans -$9,000 | Bank Capital () |
Citizen’s Bank
| Assets(A) | Liabilities(L) |
|---|---|
| Reserves -$9,000 Bank is $8,100 short of reserves | Deposits -$9,000 Bank Capital () |
Sovereign Bank
| Assets(A) | Liabilities(L) |
|---|---|
| Reserves -$8,100 Bank is $7,290 short of reserves | Deposits -$8,100 Bank Capital () |
Reverse Money Multiplier Process
Withdrawal → Loan reduction
→ Withdrawal → Loan reduction
→ Withdrawal → Loan reduction
→ … . etc.
Example: Total Change in Deposits and Money Supply
$10,000 Deposit
R = 10%
E = 0%
Example: Reverse Money Multiplier Process
$10,000 Withdrawal
R = 10%
E = 0%
Feedback? Email rob.mgmte2000@gmail.com 📧. Be sure to mention the page you are responding to.