🙋 Student Q&A (Lecture 12)
Click here to learn about timestamps and my process for answering questions. Section agendas can be found here. Email office hour questions to rob.mgmte2000@gmail.com . PS1Q2=“Question 2 of Problem Set 1”

📅 Questions covered Saturday, May 3
🕣 4:02pm
❔ I understand the basics of the CAPM equation but how do you figure out Beta? Is that a switchero as you call it? Would I divide the market risk premium by the expected risk premium? I think the math is tripping me up a little.
✔
✏️ Suppose that you predict that a given stock has an expected return of 16% whereas the market has an expected return of 10%. The risk free rate (T-Bills) is 2%. What must β be for the CAPM to hold?
Answer: We will solve this through a method that I refer to as “Plug and Chug:” https://robmunger.com/plugchug/
1. Equation → E(rs) = rf + β[E(rm) - rf] 2. Plug 🔌 → 16% = 2% + β[10% - 2%] 3. Solve 🚂 → 16% - 2% = β[8%] 14% = β[8%] β = 14%/8% =1.75 4. 🧠 → You can check math by plugging the numbers back in 2% + β[10% - 2%] = 2% + 1.75[10% - 2%] = 2%+1.75×8% = 2%+14%=16% = E(rs)
🕣
❔ How can I find graph paper?
✔ Here is some: https://2000.robmunger.com/o/c/graphpaper.png
🕣 4:09pm
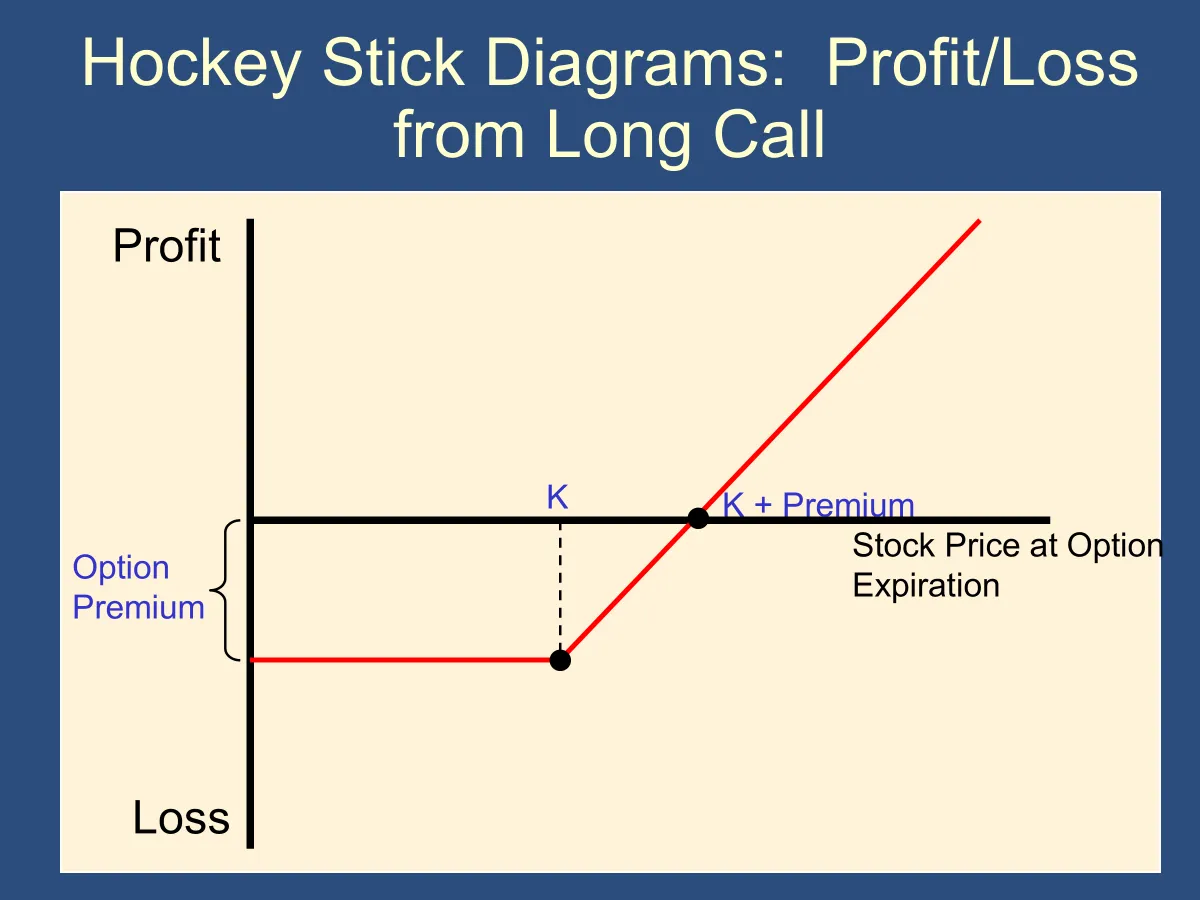
❔ On this week’s problem set Question 9 I don’t see any information on the Pfizer stock price. Blair sent an announcement about a chart being in one of the questions but didn’t mention the question number. I see the chart for Question 1 but I don’t see any further information for Question 9. Because the question is asking to show the intrinsic value the equation I believe is Strike Price- Stock Price. Can you help me understand where the stock price is for this questions? Also, does “Pfizer 28” mean the put option is $28? Thanks!!
✔ A hockey stick diagram is one of the following diagrams: (this is a hockey stick diagram for a CALL, NOT A PUT)
📅 Questions covered Tuesday, May 6
🕣 12:58pm
❔ I think I am overthinking question 1 chart for problem set #6 but was hoping you could clarify. Is there any reason to be looking at the bid or ask for the premiums or is it just simply the last column since the question says this is the option pricing? I am confused if I need to be doing any math between the last and either bid/ask to calculate the premiums.
✔ It is just the column called “last.” Use that column (either for put or for call) as the premium without any additional calculations.
🕣
❔
✔
Feedback? Email rob.mgmte2000@gmail.com 📧. Be sure to mention the page you are responding to.