🧠 Only 2.5% in Stocks?!?!
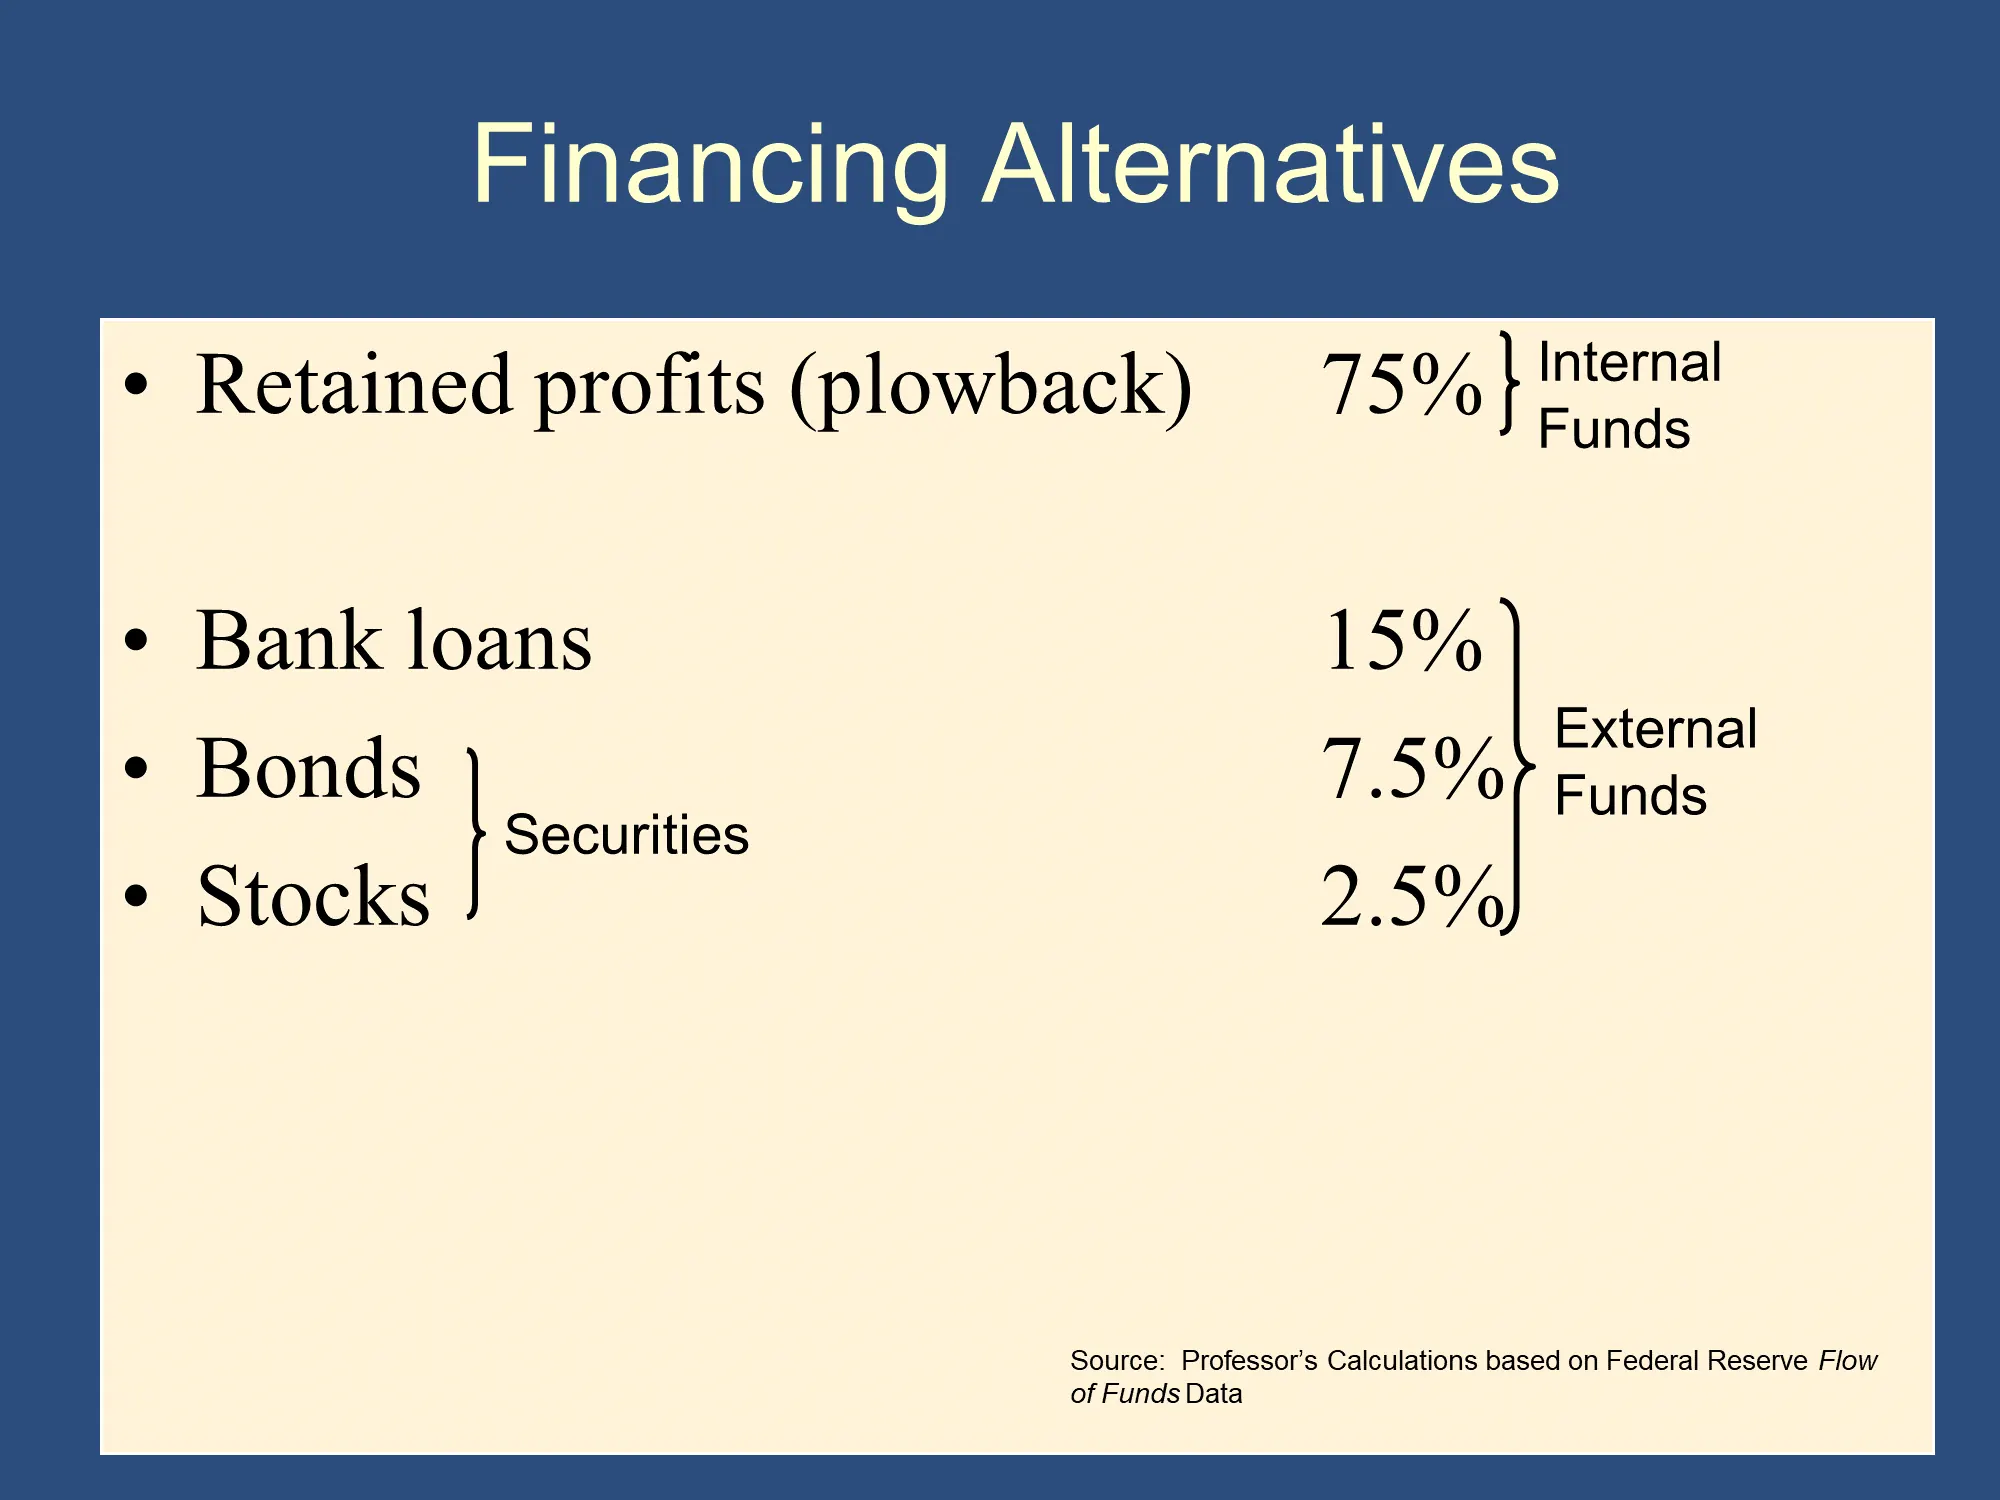
In the slide above, you might be surprised that the number for stocks, 2.5%, is so low. The stock market, after all, has a massive total value. For example, in 2022, the total value of all corporate bonds is $10 Trillion and the total value of all publicly traded stocks is around $50 Trillion.
(For comparison, total US annual income (GDP) is $21 Trillion and US national debt is $31 Trillion.)
How do we reconcile Bruce’s numbers with the fact that the stock market is worth more than the bond market?
The key is that, as the slide’s title suggests, Bruce is showing us firms’ “Financing Alternatives” - ie how firms raise the financial capital that they can use to make investments. Specifically, he’s talking about the amount of funds that firms are raising each year.
There are two reasons why this might differ from the “total value” amounts I provided earlier.
First, stocks are typically sold when a company is younger, smaller, and less valuable. Over time, the value of the stock rises, but the amount of money raised by selling the stock doesn’t change. For example, suppose I bought 10 shares of Microsoft stock from Microsoft for $210 when it first sold its stock to the public in 1986 (its IPO). Today that stock would be worth approximately five hundred thirty thousand dollars. However, the total amount that Microsoft received by selling me the stock was only $210! Clearly, the amount raised by the company can be much smaller than the amount that the shares are worth.
Second, whereas shares of stock last for as long as the company exists, bonds generally last between 1 and 30 years. After that point, they “mature” and must be paid back. Very often, this means that the firm will reissue new bonds, “rolling over” their debt and raising new funds.
For example, imagine a business opportunity that requires $1 million of physical capital and working capital. Every year, a Company A issues $1 million of bonds that only last for a year. At the end of the year, it must pay the old bonds back, so it issues new bonds to raise the funds to “roll over” the old bonds. After fifty years, it will have raised $50 million from the bonds. However, because it was just “rolling over” the same bonds every year, it would only have $1 million of financial capital that it only gets to keep for 50 years in total.
In contrast, imagine a second company, Company B, had issued $1 million of stock at the start of those fifty years. It would also have raised $1 million, and would be able to keep that money forever, because it never has to pay the stock back.
In summary:
| Total Securities Issued | Total amount of money available to purchase | |
|---|---|---|
| Company A raises $1M by issuing 1-year bonds every year for 50 years | $50 million | $1 million |
| Company B raises $1M by selling stock once | $1 million | $1 million |
Extra
(We won’t have time to cover these this semester, but you are welcome to read and ask questions…)
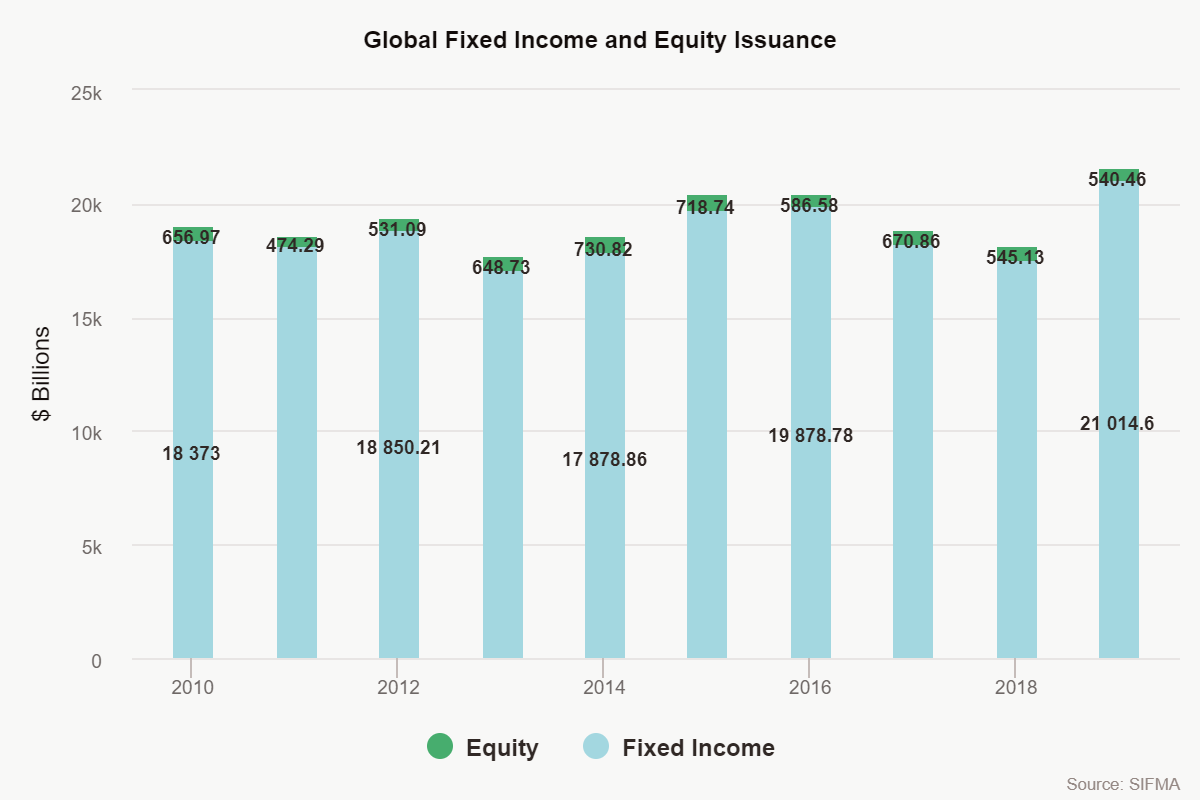
In the following diagram, you can see some data very similar to what Bruce described, with issuance of bonds and other fixed income dwarfing issuance of stocks (aka equities) on a global basis:
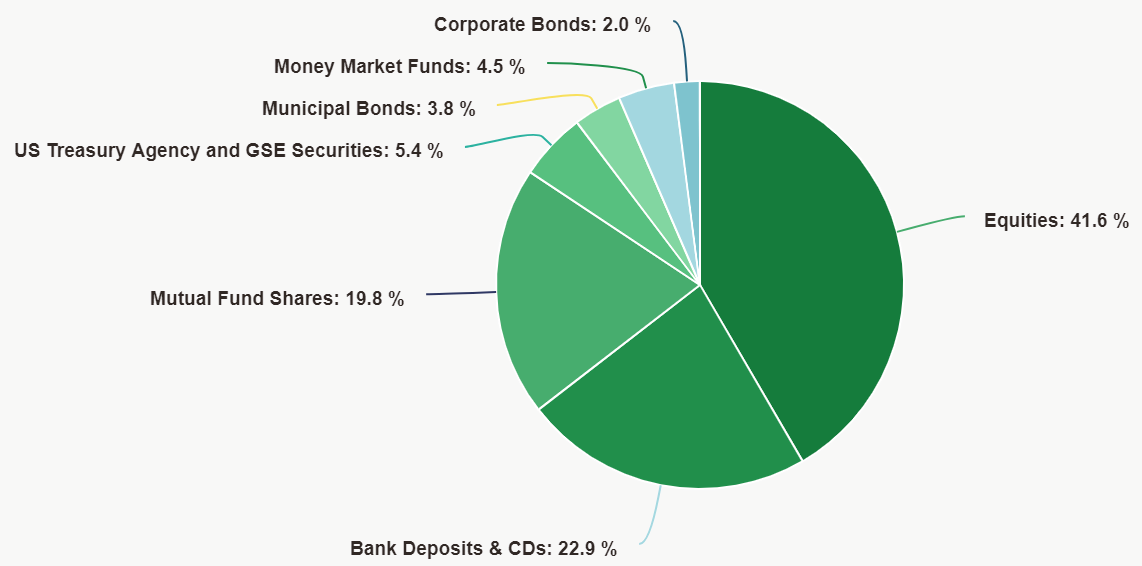
Having seen some of the unintuitive results from looking at money raised/issuance, I thought you might like to see how household asset holding contrast with the above data. The following chart shows US household financial assets that can be sold on active markets.
Directly held stocks, at 41.6%, are a much larger component than directly held corporate bonds at a mere 2%. (Technical Caveats: some stocks and bonds might be held in mutual funds or Money Market Funds, and this only refers to assets owned by households, so we don’t want to draw too many conclusions from the diagram.)
U.S. Household Liquid Financial Assets; 2019
The data in these graphs came from the Federal Reserve Flow of Funds data.
Glossary:
[Note: These are very basic definitions. We will provide more precise definitions of each of these terms later in the course.]
- Liquid = can be sold quickly at a fair price. If you lend money to a friend, that is a financial asset, but because you might have difficulty selling that loan to someone else, it is not a liquid financial asset.
- Equities = Stocks
- Banks Deposits are your checking accounts. We will start learning about these next week. CDs are 'certificates of deposit.' This means that you give your money to a bank for a fixed period - perhaps 6 months. Because they know that you won’t withdraw your money for 6 months, they can lend your money out and earn interest on it. Therefore, they can pay you a higher rate of interest. People use certificates of deposit when they know they won’t need the money for a while.
- Bonds . When a large company, national government or local government needs to borrow a lot of money, they divide their debt up into chunks called bonds. These bonds are essentially promises to pay the owner a certain amount of money at some point in the future. For an investor, these bonds provide “fixed income,” so bonds are often called “fixed income.”
- Mutual Fund Shares . Knowing which stocks to buy is challenging. With a Mutual fund, you just buy a share of the mutual fund and a professional investor invests the money on your behalf, often buying stocks or bonds.
Feedback? Email rob.mgmte2000@gmail.com 📧. Be sure to mention the page you are responding to.